Branded link analytics turns every short link into a measurement opportunity for your campaigns. In SMS, RCS, and OTT messengers this matters because the link often serves as the bridge between engagement and actual business outcome: click, conversion, revenue, reply, opt-out, or abandonment.
A branded short link is not simply a cleaner URL. It can show whether your CTA works, whether one channel outperforms another, whether a segment is under-converting, and whether a campaign is driving revenue or only generating curiosity clicks. That is crucial in SMS marketing with conversion tracking, where a high CTR can look like success until CVR or revenue per message tells a different story.
The challenge is that click data can be misleading. RCS previews, messaging app crawlers, bots, duplicate clicks, device routing, carrier behavior, and weak UTM discipline can all distort the numbers. If those signals are not separated, you may be optimizing for noise instead of human behavior.
In this guide I explain how to measure branded links across SMS, RCS, and Viber with a practical performance chain: CTR → CVR → revenue per message. I cover channel benchmarks, A/B testing rules, cohort analysis, bot click filtering, and link health monitoring, so your campaign reporting shows what actually happened after the message was delivered.
Branded link analytics: Metrics that actually matter
Branded link analytics is the process of measuring what happens after someone receives a branded short link and decides to click. For SMS, RCS, and OTT messengers this measurement should not stop at CTR. A click is useful only when you can connect it to the next step like conversion, revenue, reply, opt-out, or another campaign result.
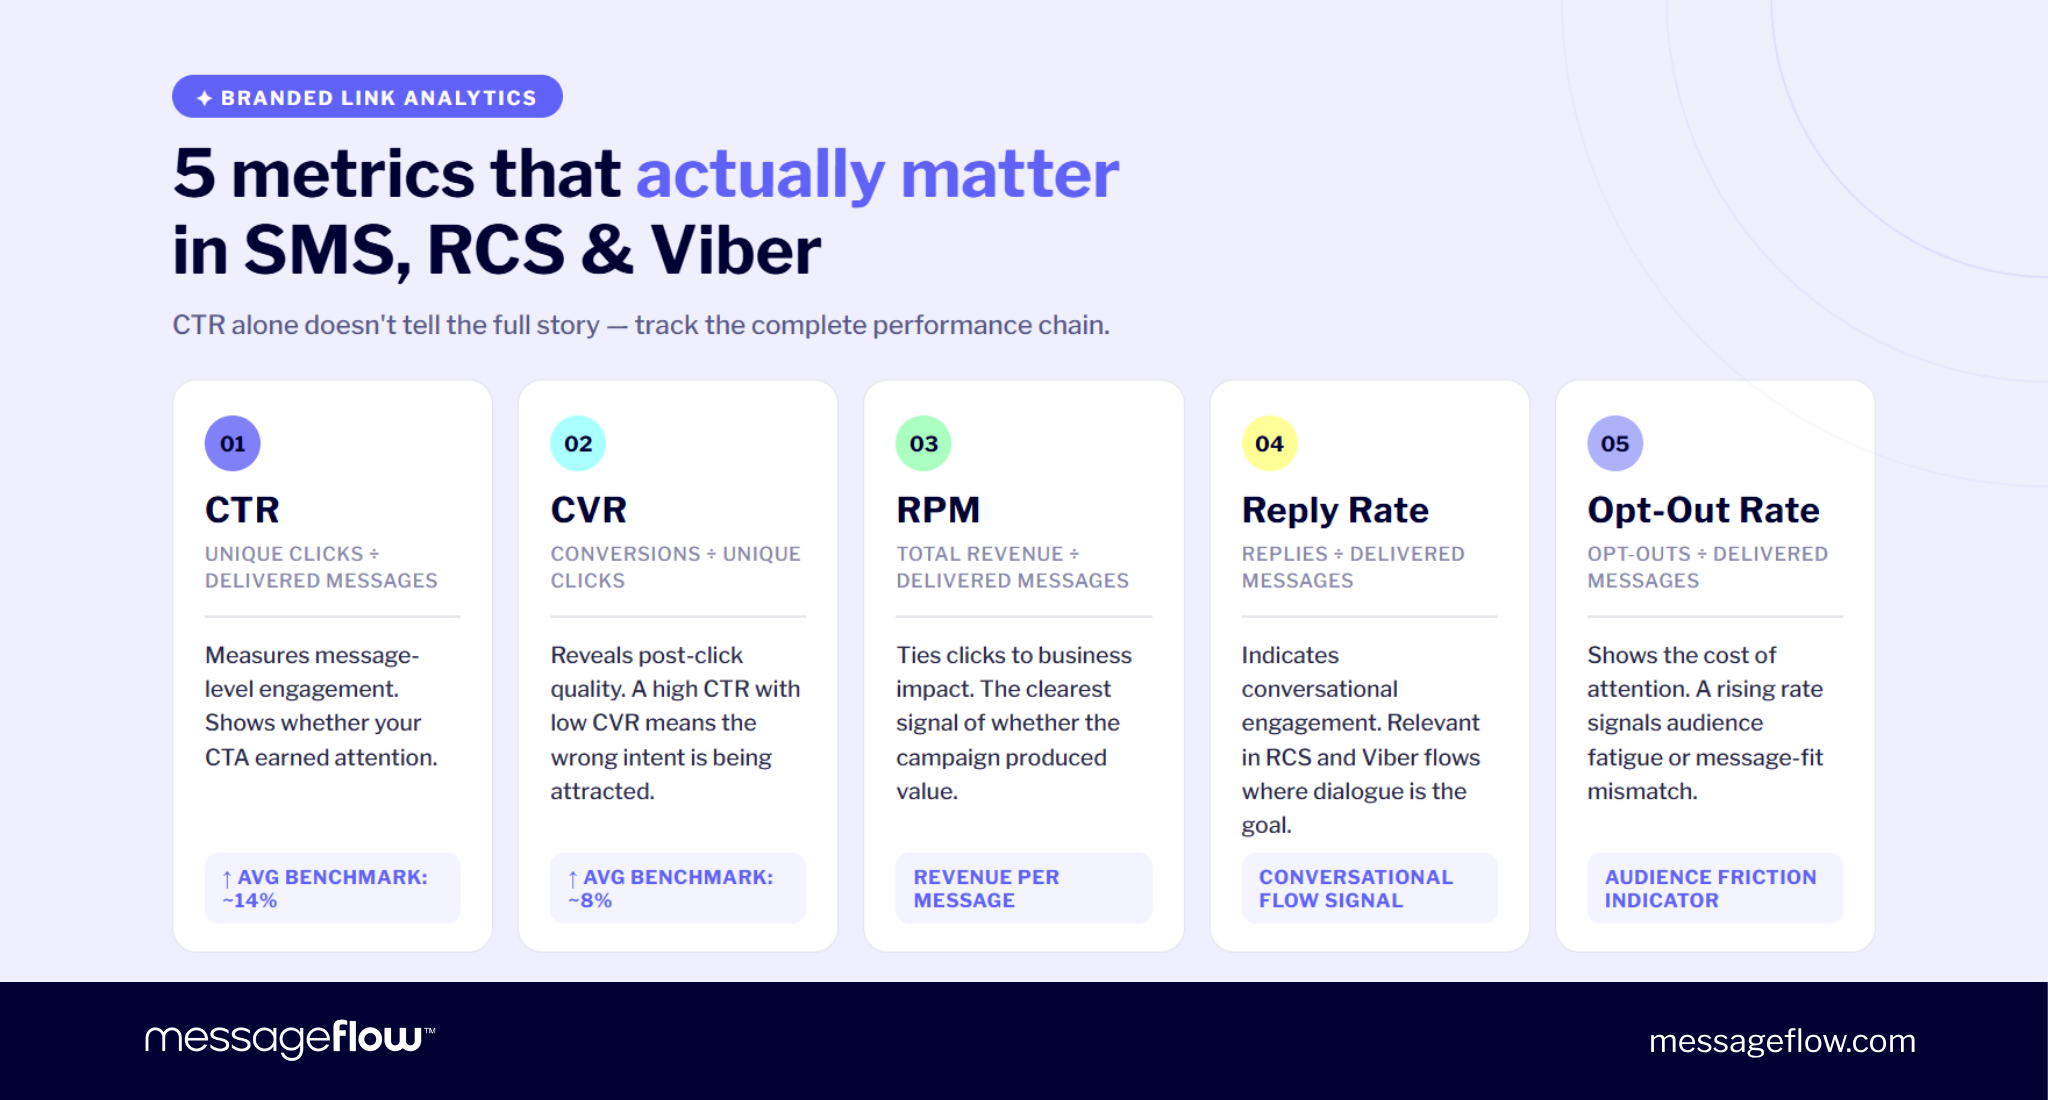
Start with a shared metric language:
| Metric | Formula | What it tells you |
|---|---|---|
| CTR | unique clicks / delivered messages | How many delivered messages generated a click |
| CVR | conversions / unique clicks | How many clickers completed the intended action |
| RPM | total revenue / delivered messages | How much revenue each delivered message produced |
| Reply rate | replies / delivered messages | How many users entered a conversational flow |
| Complaint or opt-out rate | opt-outs / delivered messages | Whether the campaign created friction or fatigue |
A simple example:
10,000 SMS delivered
1100 unique clicks
242 purchases
€12,100 revenue
14 opt-outs
That gives you:
- CTR: 11%
- CVR: 22%
- RPM: €1.21
- opt-out rate: 0.14%
Those numbers would usually point to a strong campaign but the important part is the chain. CTR shows message-level engagement. CVR shows post-click quality. RPM shows business impact. Opt-outs show the cost of attention.
This is where a link report may get misleading. A campaign can produce a high CTR because the message creates urgency, curiosity, or even confusion. But if those clicks do not convert, the short link may be attracting the wrong intent. The report looks healthy at the top, while the funnel leaks immediately after the click.
This is why SMS marketing with conversion tracking should connect three layers:
- Delivered message data from the messaging platform.
- Branded short link click data from the redirect layer.
- Conversion and revenue data from GA4, ecommerce, CRM, or backend events.
UTM parameters should stay on the destination URL, not on the visible branded short link. The user sees a clean link such as go.brand.co/sale, while GA4 receives the tagged destination after the redirect, for example:
brand.com/sale?utm_source=sms&utm_medium=sms&utm_campaign=spring-sale
Third-party data helps but it should not replace your own baseline. Some SMS benchmarks show an average CTR of 14.06% and average CVR of 8.22%, while RCS and Viber examples often display strong engagement in richer, more interactive journeys. Treat those as directional context, not universal targets.
Instead of wondering whether your CTR is good, start thinking in terms of: “Does this link generate the right action from the right audience at an acceptable cost?” That is the point of branded link analytics: not more numbers, but cleaner decisions.
A/B testing branded short links: What to test and how to avoid false wins
A/B testing branded short links in SMS and other channels only makes sense when the result can actually influence a decision. Testing a slug because it is easy to test is not enough. The useful question is whether the link variant can improve click quality, conversion rate, revenue per message, or channel strategy.
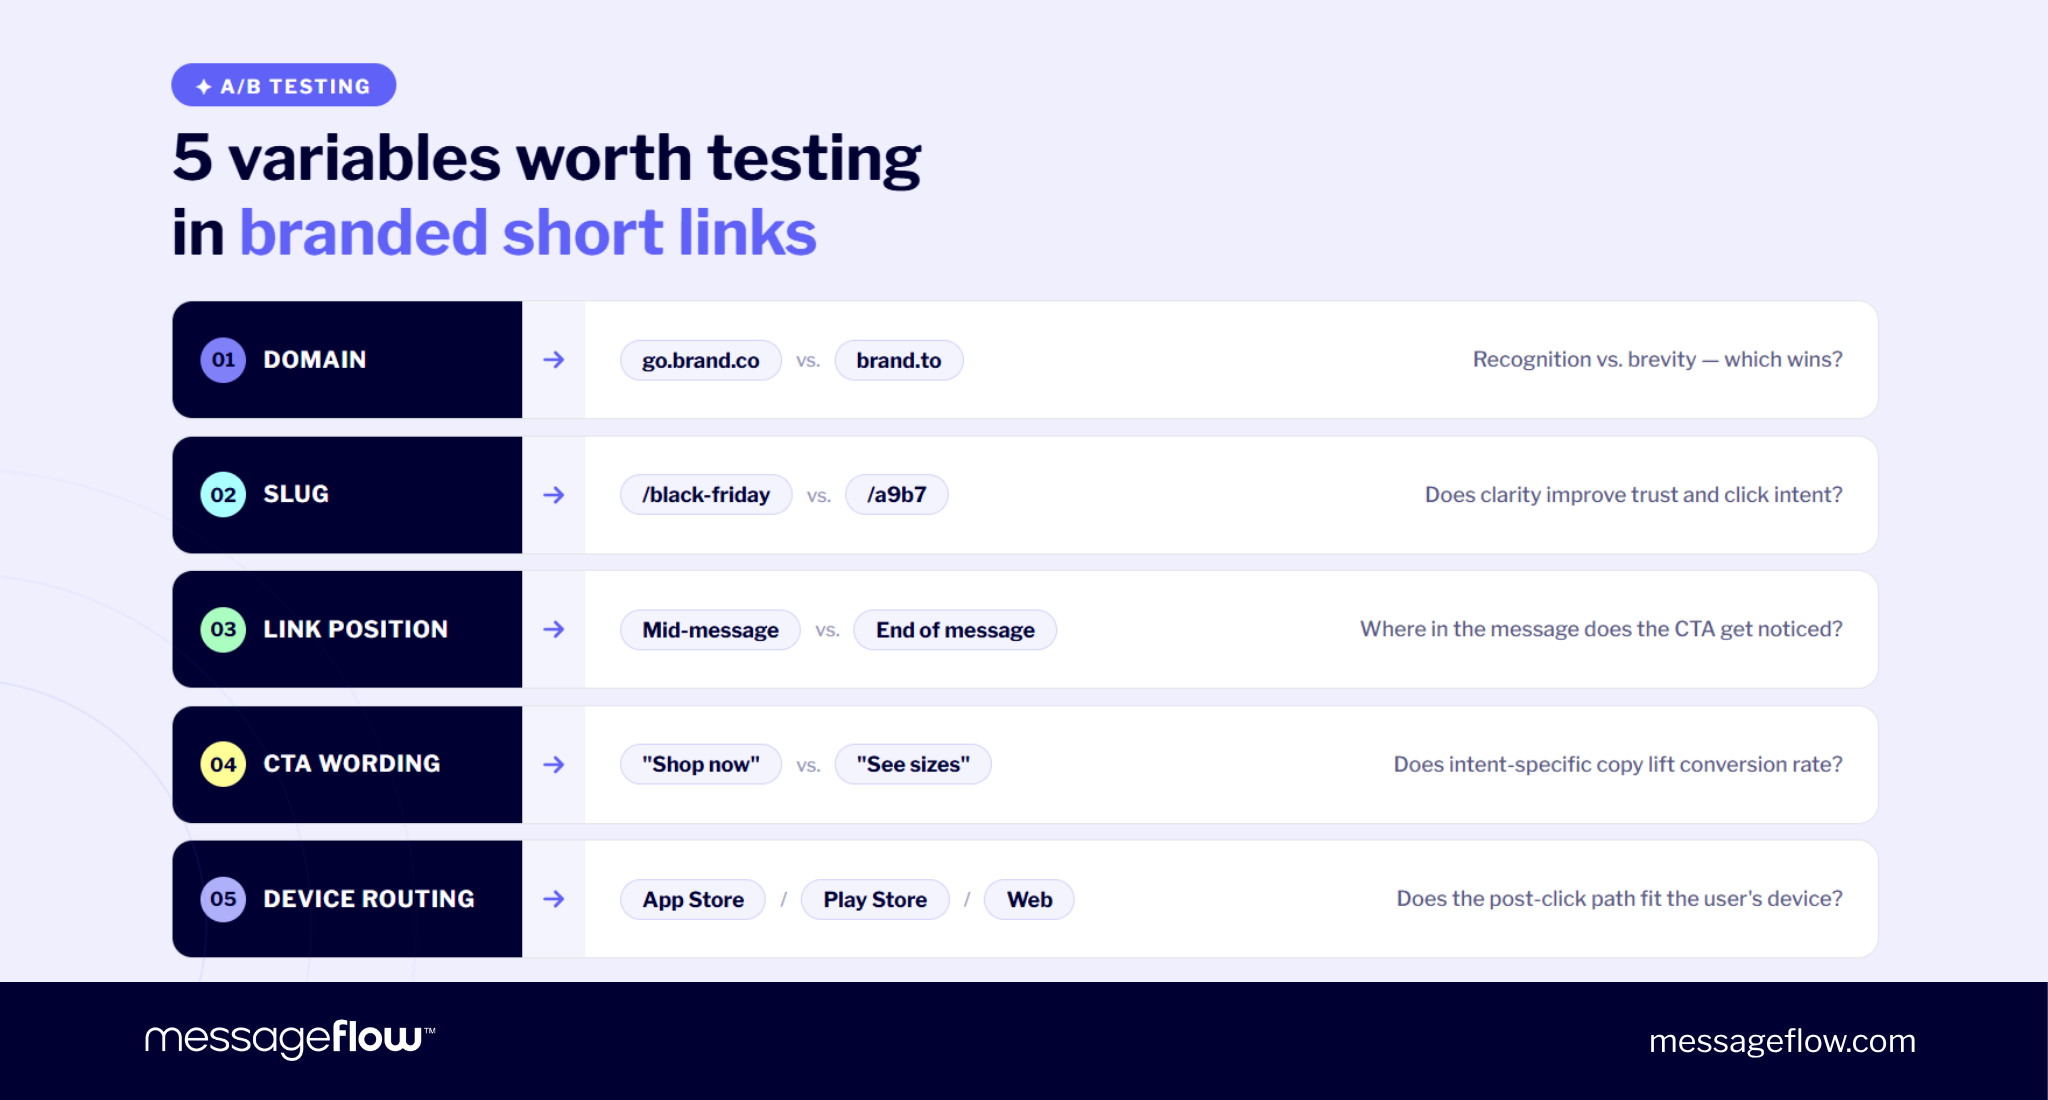
The strongest branded link tests usually focus on five variables:
| Test area | Example variants | What you learn |
|---|---|---|
| Domain surface | go.brand.co vs. brand.to | Whether recognition or brevity wins |
| Slug semantics | /runpro vs. /new vs. /a9b7 | Whether clarity beats compactness |
| Link position | Mid-message vs. end of message | Where the CTA gets noticed |
| CTA wording | “Shop now” vs. “See sizes” | Whether intent-specific copy improves conversion |
| Device routing | One short link routing to App Store, Play Store, or web | Whether the post-click path fits the user’s device |
Readable slugs often perform better than cryptic ones because they reduce uncertainty. A link like go.brand.co/black-friday gives the user a clearer expectation than go.brand.co/a9b7. That does not guarantee a higher CTR in every campaign but it gives the test a meaningful hypothesis: clarity may increase trust and improve click intent.
A simple test plan could look like this:
- Hypothesis: A readable slug improves CTR compared with a cryptic slug.
- Variant A: go.brand.co/runpro
- Variant B: go.brand.co/a9b7
- Primary metric: CTR
- Sanity-check metrics: CVR and revenue per message
- Stop rule: Run until the required sample size is reached, across a full business cycle.
The stop rule is not to be overlooked. Many false wins happen because teams check the report too early, see one variant ahead, and stop the test before the result stabilizes. This is especially risky in SMS, RCS, and Viber, where delivery timing, weekday behavior, and segment composition can change results quickly.
Keep the process strict:
- Choose one primary metric before launch.
- Define the smallest lift that would change your decision.
- Calculate the sample size per variant.
- Run through at least one full business cycle, including a weekend if relevant.
- Do not stop early because the chart looks clear.
- Filter bot and preview clicks before judging the winner.
💡 Open rate or click rate alone can mislead when the conversion rate tells a different story. One CTA variant may drive more engagement, while another produces fewer clicks but more buyers.
That is why branded link testing should never evaluate CTR in isolation. If Variant A wins CTR but Variant B wins CVR and revenue per message, the better business decision may be Variant B. The goal is not to make the link more clickable at any cost. Instead, aim to make the message path more profitable, measurable, and repeatable.
Cohort analysis across SMS, RCS, and Viber
Average CTR is useful for a quick read, but it can hide the exact performance gap you need to fix. Cohort analysis breaks branded link analytics into smaller groups so you can see whether the problem sits in the audience, channel, device, country, carrier, or post-click path.
The most useful cohorts are usually:
| Cohort | What to compare | Why it matters |
|---|---|---|
| New vs. returning users | CTR, CVR, RPM | Returning users may click less often but convert better |
| Channel | RCS vs. SMS vs. Viber | Each channel creates a different level of context and intent |
| Device or OS | Android vs. iOS | App routing, deep links, and store behavior can change CVR |
| Country or carrier | CTR, failed clicks, latency | Filtering, preview behavior, and delivery timing can differ by network |
| Customer segment | Loyalty tier, cart abandoners, recent buyers | Similar CTR can produce very different revenue outcomes |
This matters especially when comparing SMS, RCS, and Viber. SMS is direct, compact, and fast. RCS can add richer context through cards, buttons, images, and suggested actions. Viber can support more conversational and visual flows in markets where users are already active on the app. If all three channels are measured only through one blended CTR number, the report loses most of its diagnostic value.
For example, an RCS campaign may produce fewer raw clicks than an SMS campaign but higher conversion because the user receives more context before tapping. A Viber cart recovery message may perform strongly among returning users because the audience already recognizes the brand and the buying intent is recent. This is what Auchan Ukraine saw and was able to attribute a 20% revenue share to its Viber users.
Device routing is another common source of hidden loss. If an Android cohort under-converts on an app-install campaign, the problem may not be the message or the link. The short link may be sending users to the mobile web instead of Google Play or the right in-app screen. On iOS, the same campaign may behave differently because the App Store path, deep-link handling, or browser behavior changes the post-click experience.
Carrier and country cohorts can also reveal issues that a global report misses. If one carrier shows lower CTR, higher failed clicks, or unusual latency, audit the message content, domain reputation, redirect speed, and link preview behavior for that slice. The campaign may be healthy overall while one route is quietly underperforming.
Good cohort analysis does not mean you have to create dozens of reports no one reads. Start with the cuts most likely to change an action: channel, device, new vs. returning users, and country or carrier for high-volume SMS. Then connect each cohort back to the performance chain: CTR, CVR, revenue per message, and opt-outs.
💡 The goal is simple: Instead of asking whether the campaign worked, start seeing where it did, where it leaked, and which path deserves more budget.
Bot click filtering and link health monitoring
Branded link analytics provides meaningful data only if the click count represents real people. If preview bots, crawlers, duplicate requests, and automated security checks are counted as regular clicks, CTR becomes inflated and every downstream decision becomes weaker.
This is not a marginal issue. Google’s own RCS documentation states that teams measuring engagement through HTTP requests to a URL must filter bot and preview traffic. It also notes broader bot-traffic research from Imperva and Cloudflare showing how much web activity can come from automated sources rather than humans.
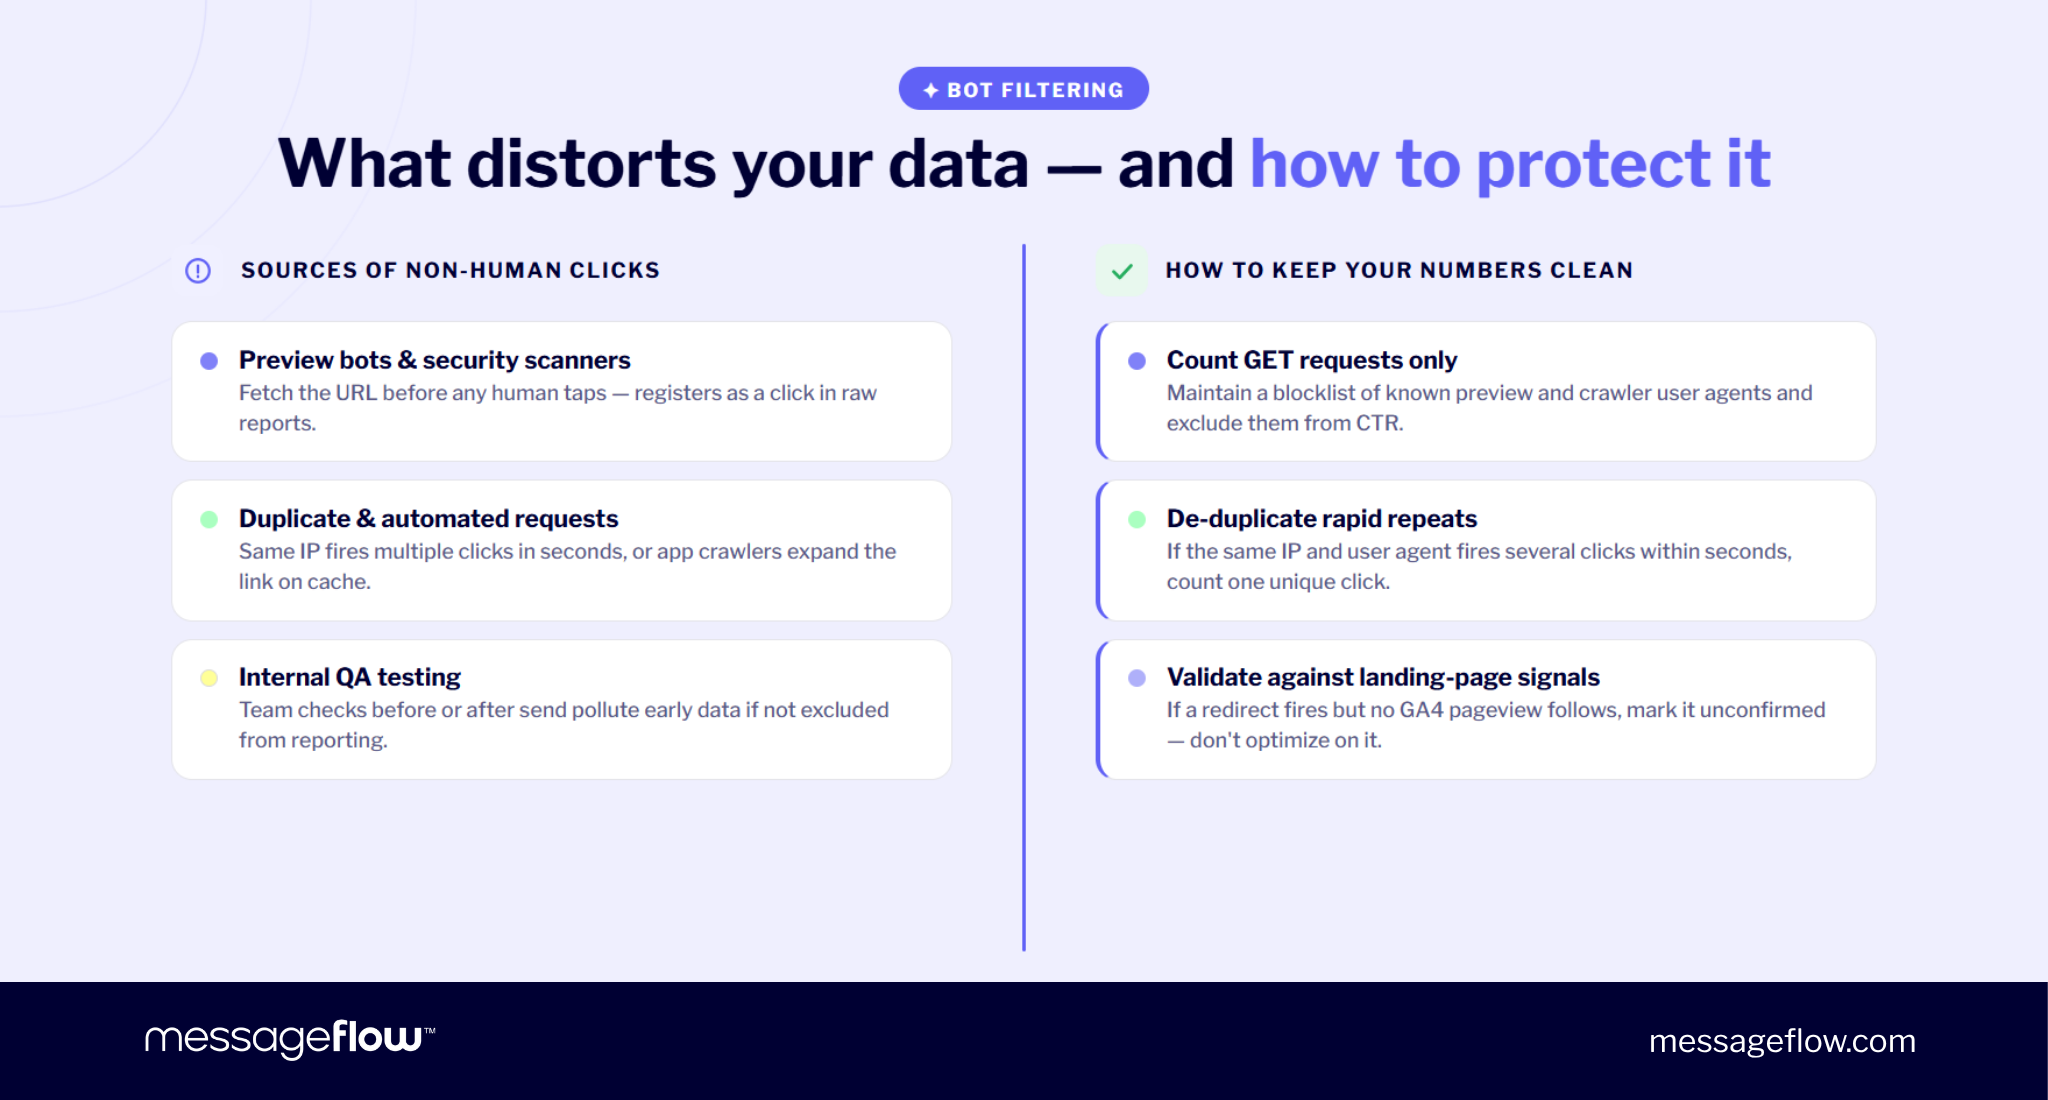
In messaging campaigns, non-human clicks can come from several places:
| Source | What it does | Why it distorts reporting |
|---|---|---|
| Link preview bots | Fetch the URL to generate a preview | Can look like a user clicked before anyone engaged |
| Security scanners | Check links for malicious content | May trigger redirects automatically |
| Social or app crawlers | Expand links when shared or cached | Can create extra requests outside the campaign context |
| Duplicate requests | Repeat the same request quickly | Can inflate raw click counts |
| Internal QA | Team members testing links | Can pollute early campaign data if not excluded |
The fix is to store the raw event but separate confirmed human engagement from traffic that should not drive optimization.
💡 Useful filtering rules include:
- Count GET requests, not HEAD requests.
- Maintain a list of known preview and crawler user agents.
- De-duplicate rapid repeats from the same IP and user agent.
- Compare redirect clicks with landing-page events in GA4 or another analytics tool.
- Mark clicks without a follow-up pageview or conversion signal as unconfirmed.
For example, if a request comes from a known preview user agent, classify it as preview traffic and exclude it from CTR. If the same IP and user agent fires several clicks within a few seconds, count one unique click rather than every request. If the redirect happens but no landing-page signal appears shortly afterward, keep the event for diagnostics but avoid optimizing based on it.
This is particularly important in RCS analytics and Viber analytics because richer messaging environments can trigger previews or platform checks that do not behave like a human tap. Without filtering, one channel may appear to outperform another simply because its preview mechanics generate more requests.
Link health should be monitored with the same diligence. A campaign link can fail even when the message copy, audience, and offer are correct. The most important checks are:
- SSL validity and certificate coverage
- expected redirect status, usually 302 for campaign links
- destination availability
- preservation of UTM parameters
- redirect latency and time to first byte
- broken links after landing page updates
A broken or slow short link can quietly damage a live campaign. Users may not report the issue, and the dashboard may only show a sudden drop in CTR or CVR. By the time you notice, the campaign window may already be gone.
That is why bot click filtering and link health monitoring belong in the same section of the workflow. One protects the accuracy of the numerator. The other protects the campaign path itself. If either fails, the report stops describing real user behavior.
💡 When evaluating a vendor, these are among the first areas worth probing — the enterprise URL shortener RFP checklist covers the specific questions to ask.
Quick checklist for branded link optimization
A branded link analytics needs to be consistent, first and foremost. Use this checklist before judging campaign results or scaling a winning variant.
- Define the performance chain before launch
Decide how the campaign will be judged: CTR, CVR, revenue per message, reply rate, opt-outs, or a combination of these metrics. CTR alone is not enough. - Add UTM parameters to the destination URL
Keep the visible branded link clean, but make sure the final landing page URL contains consistent UTM values. GA4 should receive the full tagged URL after the redirect. - Use a 302 redirect for campaign links
Campaign destinations change. A 302 redirect keeps the short link flexible and avoids treating a temporary campaign route as a permanent move. - Predefine the A/B test rule
Choose the primary metric, minimum detectable effect, sample size, and test duration before launch. Do not stop early because one variant appears ahead. - Segment the results
Compare performance by channel, device, new vs. returning users, country, carrier, and customer segment. Blended averages hide operational problems. - Filter bot and preview traffic
Exclude known previewers, crawlers, duplicate automated requests, and suspicious clicks from performance reporting. Store the raw data, but optimize only on cleaned human engagement. - Validate clicks against landing-page signals
A redirect event is not always a human visit. Compare short-link clicks with GA4 pageviews, ecommerce events, CRM events, or backend conversion data. - Monitor link health continuously
Check SSL validity, redirect status, UTM preservation, destination availability, and latency. A link can fail while the campaign runs live. - Connect reporting to decisions
Every report should answer what to do next: change the CTA, adjust the segment, move budget between SMS, RCS, and Viber, fix routing, or stop a weak journey.
The point of branded link analytics is to make campaign performance harder to misread. The stronger the measurement layer, the easier it becomes to see whether SMS, RCS, or Viber is producing real business value rather than surface-level engagement.
FAQ – Branded link analytics
Branded link analytics is the measurement layer behind branded short links. It tracks how recipients interact with links in campaigns and connects those clicks to outcomes such as conversions, revenue, replies, opt-outs, and campaign-level ROI.
It matters because SMS and RCS often rely on the link as the main action point. In SMS, the link usually carries the CTA directly. In RCS, the link may sit behind a button, card, or suggested action. In both cases, measuring clicks alone is not enough. You need to know whether those clicks produced the intended result.
A high CTR with low conversions usually means the message is generating clicks but the post-click journey is failing or attracting the wrong intent.
Common causes include:
- the CTA creates curiosity but not purchase intent
- the landing page does not match the message promise
- the offer is unclear after the click
- the page loads too slowly on mobile
- the link routes users to the wrong destination for their device
- UTM or conversion tracking is broken
- bot or preview traffic is inflating click numbers
This is why SMS marketing with conversion tracking should never stop at CTR. CTR tells you whether the message earned attention while CVR and revenue per message show whether that attention was valuable.
Start by separating raw click events from confirmed human engagement. Do not delete suspicious events but do not use them to judge campaign performance either.
This matters especially for RCS, Viber, social sharing, and app-based environments where previews, crawlers, or security checks may request the URL before a human user taps it. The brief specifically highlights bot and preview traffic as a reporting risk in branded link analytics.
There is no universal number because the required sample depends on your baseline CTR, the size of the lift you want to detect, and how confident you need to be in the result.
A practical workflow is:
- Check your recent baseline CTR.
- Decide the smallest lift that would change your decision.
- Enter both values into a sample-size calculator.
- Use the result as the required number of delivered messages per variant.
- Run the test until that number is reached.
For example, if your baseline CTR is 8% and you only care about changes of at least 10% relative lift, your test should be sized around that difference. Smaller expected lifts require larger samples. If the test cannot reach enough volume, treat the result as directional rather than decisive.
Yes, the same core setup can work across SMS, RCS, and Viber: branded short domain, HTTPS, 302 redirect, destination URL with UTM parameters, click tracking, and conversion measurement.
What changes is the interpretation. SMS is compact and direct, so CTR often reflects message clarity and urgency. RCS can create more context before the click through rich cards, buttons, images, and suggested actions. Viber can behave differently again depending on market adoption, message format, and user expectations.
That is why the analytics setup should be consistent, but the reporting should be segmented by channel. A blended CTR across SMS, RCS, and Viber may hide the most useful insight: which channel creates the best conversion path for a specific audience, offer, or journey.