A lower email open rate after a platform migration is often caused by differences in deliverability, tracking methodology, and mailbox provider behaviour, and not necessarily by worse campaign performance.
This article breaks down the technical and structural reasons your open rate may have dropped, and explains what to measure instead.
TL;DR
- Open rate is no longer a reliable standalone KPI. Privacy tools, security filtering, AI-generated inbox summaries, and mailbox provider behaviour all distort the signal in both directions.
- A lower email open rate after migration often reflects stricter measurement methodology rather than worse campaign performance.
- Different platforms measure opens differently, particularly around bot filtering, Apple MPP classification, and open deduplication. Cross-platform comparisons are rarely meaningful.
- Open rate is most useful as a directional deliverability signal. A sudden, sharp drop is worth investigating; a gradual decline on its own is less conclusive.
- Conversions, revenue per email, click-through rate, and deliverability health metrics provide a more reliable picture of campaign performance than open rate alone.
What is open rate and how is it measured?
Open rate is the percentage of delivered emails that were recorded as opened. The formula is simple: unique opens as a percentage of delivered messages.
The tricky part is what counts as an “open”. Email platforms don’t know when a human actually reads a message, because mailbox providers simply do not share that information. Instead, they rely on a tracking pixel: a tiny invisible image (typically a 1×1 pixel) embedded in the email’s HTML. When the email is opened and images load, that pixel is fetched from the sender’s server. That fetch gets logged as an open.
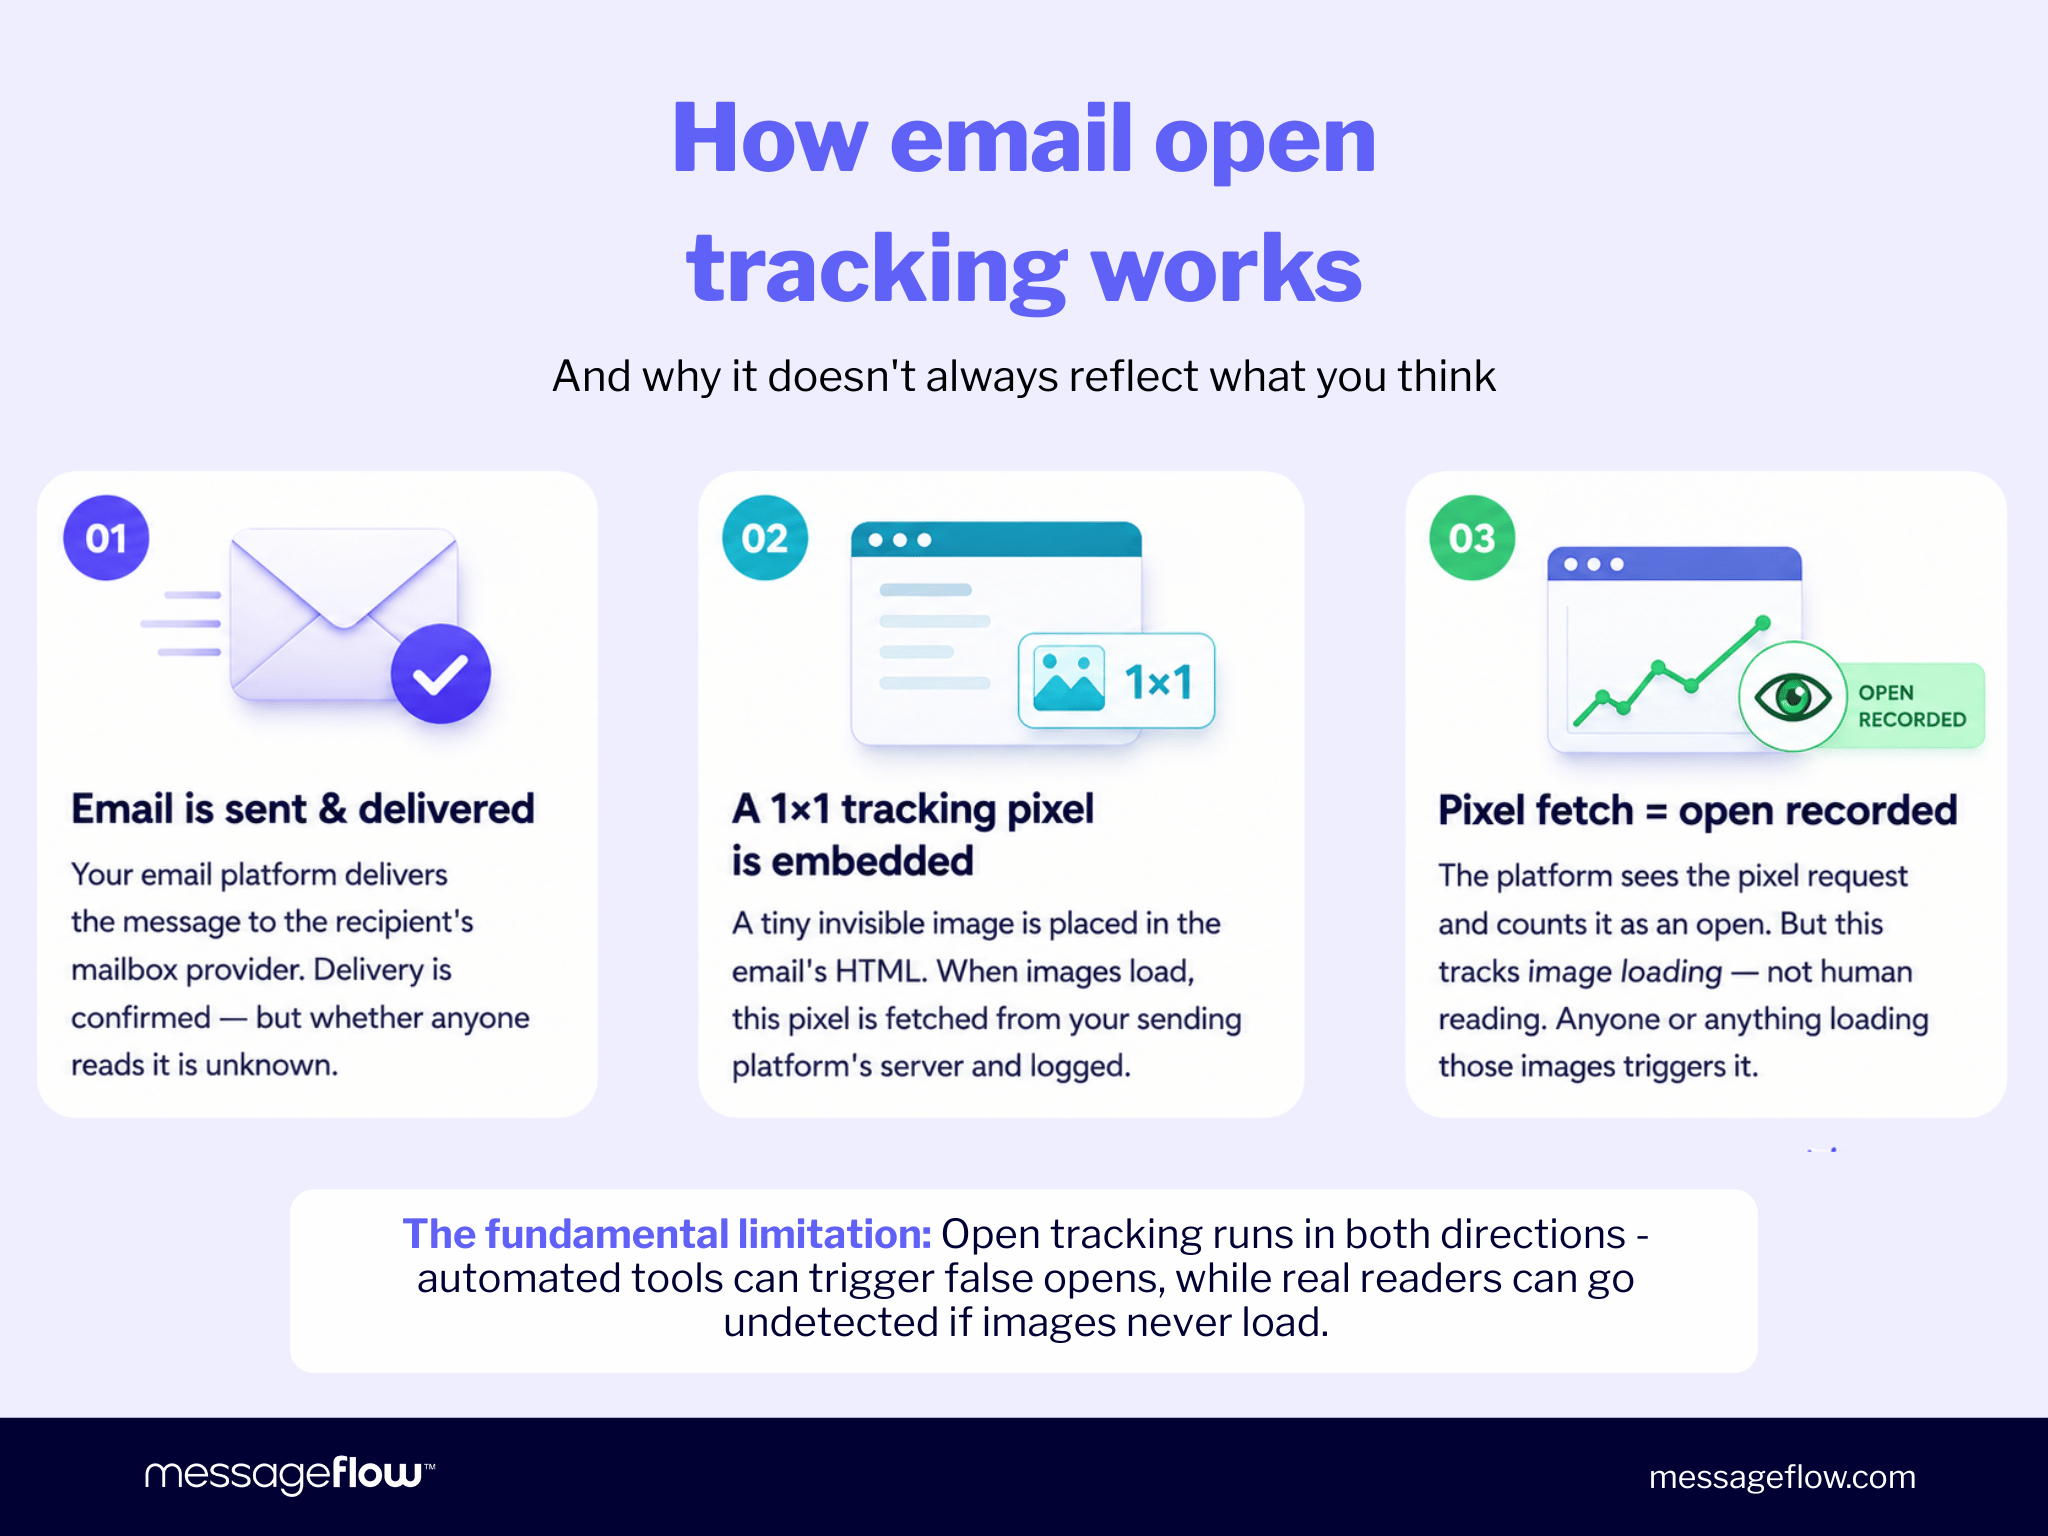
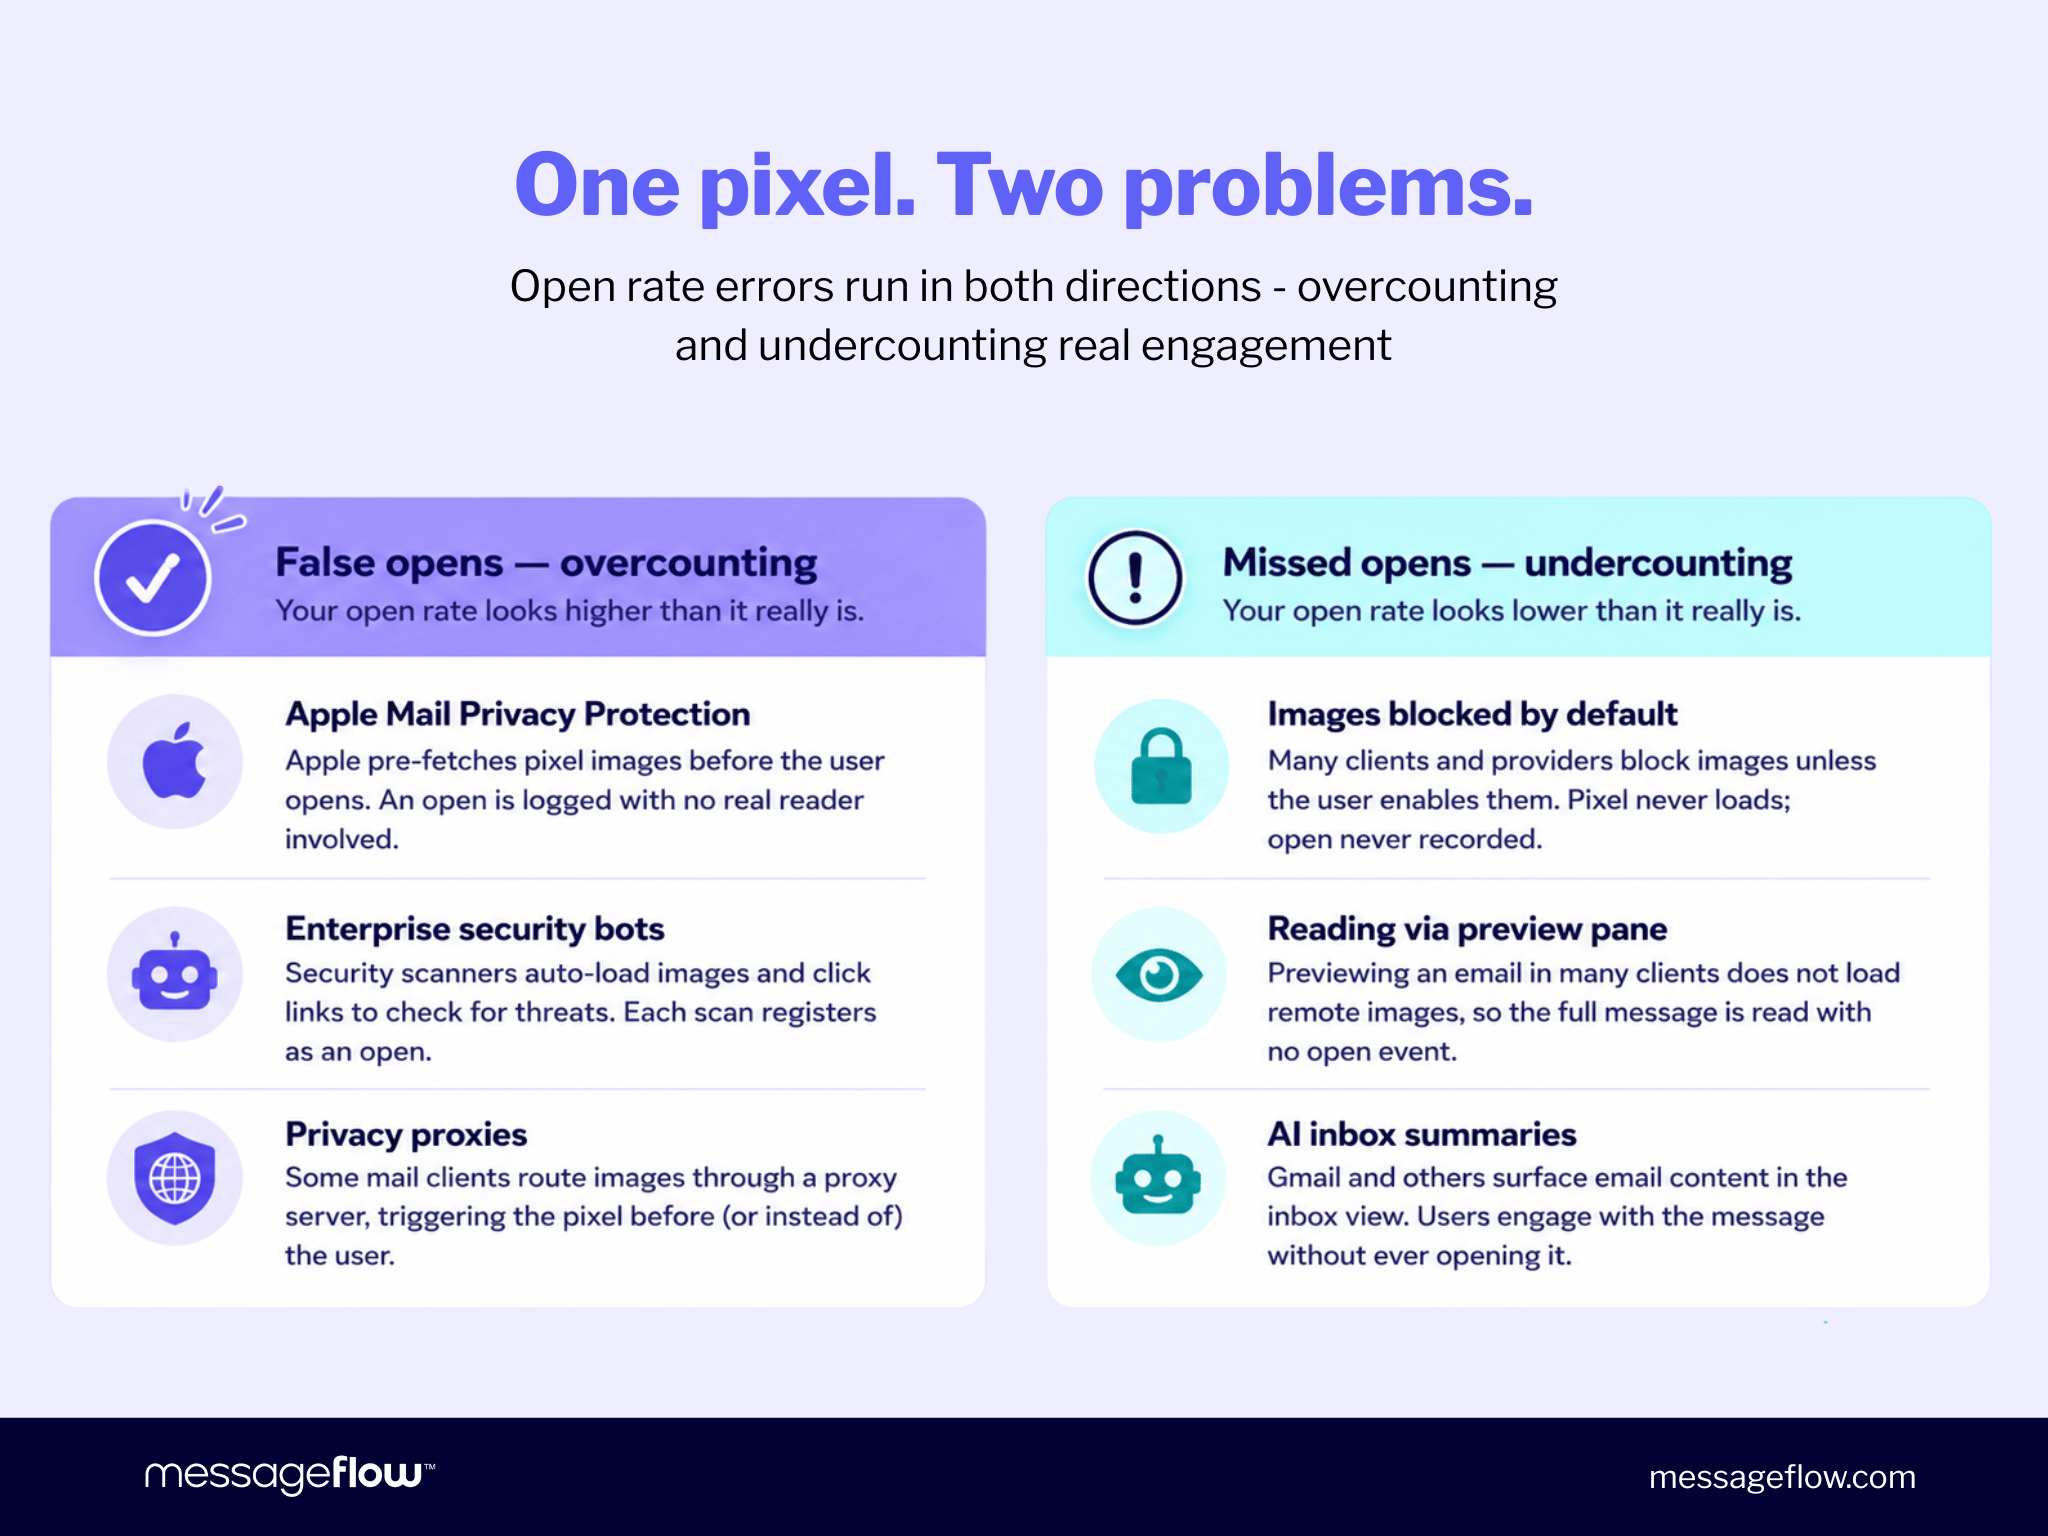
The mechanism has a fundamental weakness because it tracks image loading, not human reading. The error runs in both directions. An open can be recorded without any real person engaging. This happens, for example, when a security scanner or privacy proxy loads the images automatically. But a real person can also read an email without generating an open event at all. This occurs when images are blocked, content is previewed directly in the inbox, or an AI-generated summary surfaces the message without fully opening it.
Because of these limitations, open rate today is often more useful as a deliverability signal than as a measure of engagement. That distinction is what the rest of this article is about.
Technical reasons your open rate may be low
Before drawing any conclusions about your campaigns, it’s worth ruling out genuine deliverability issues.
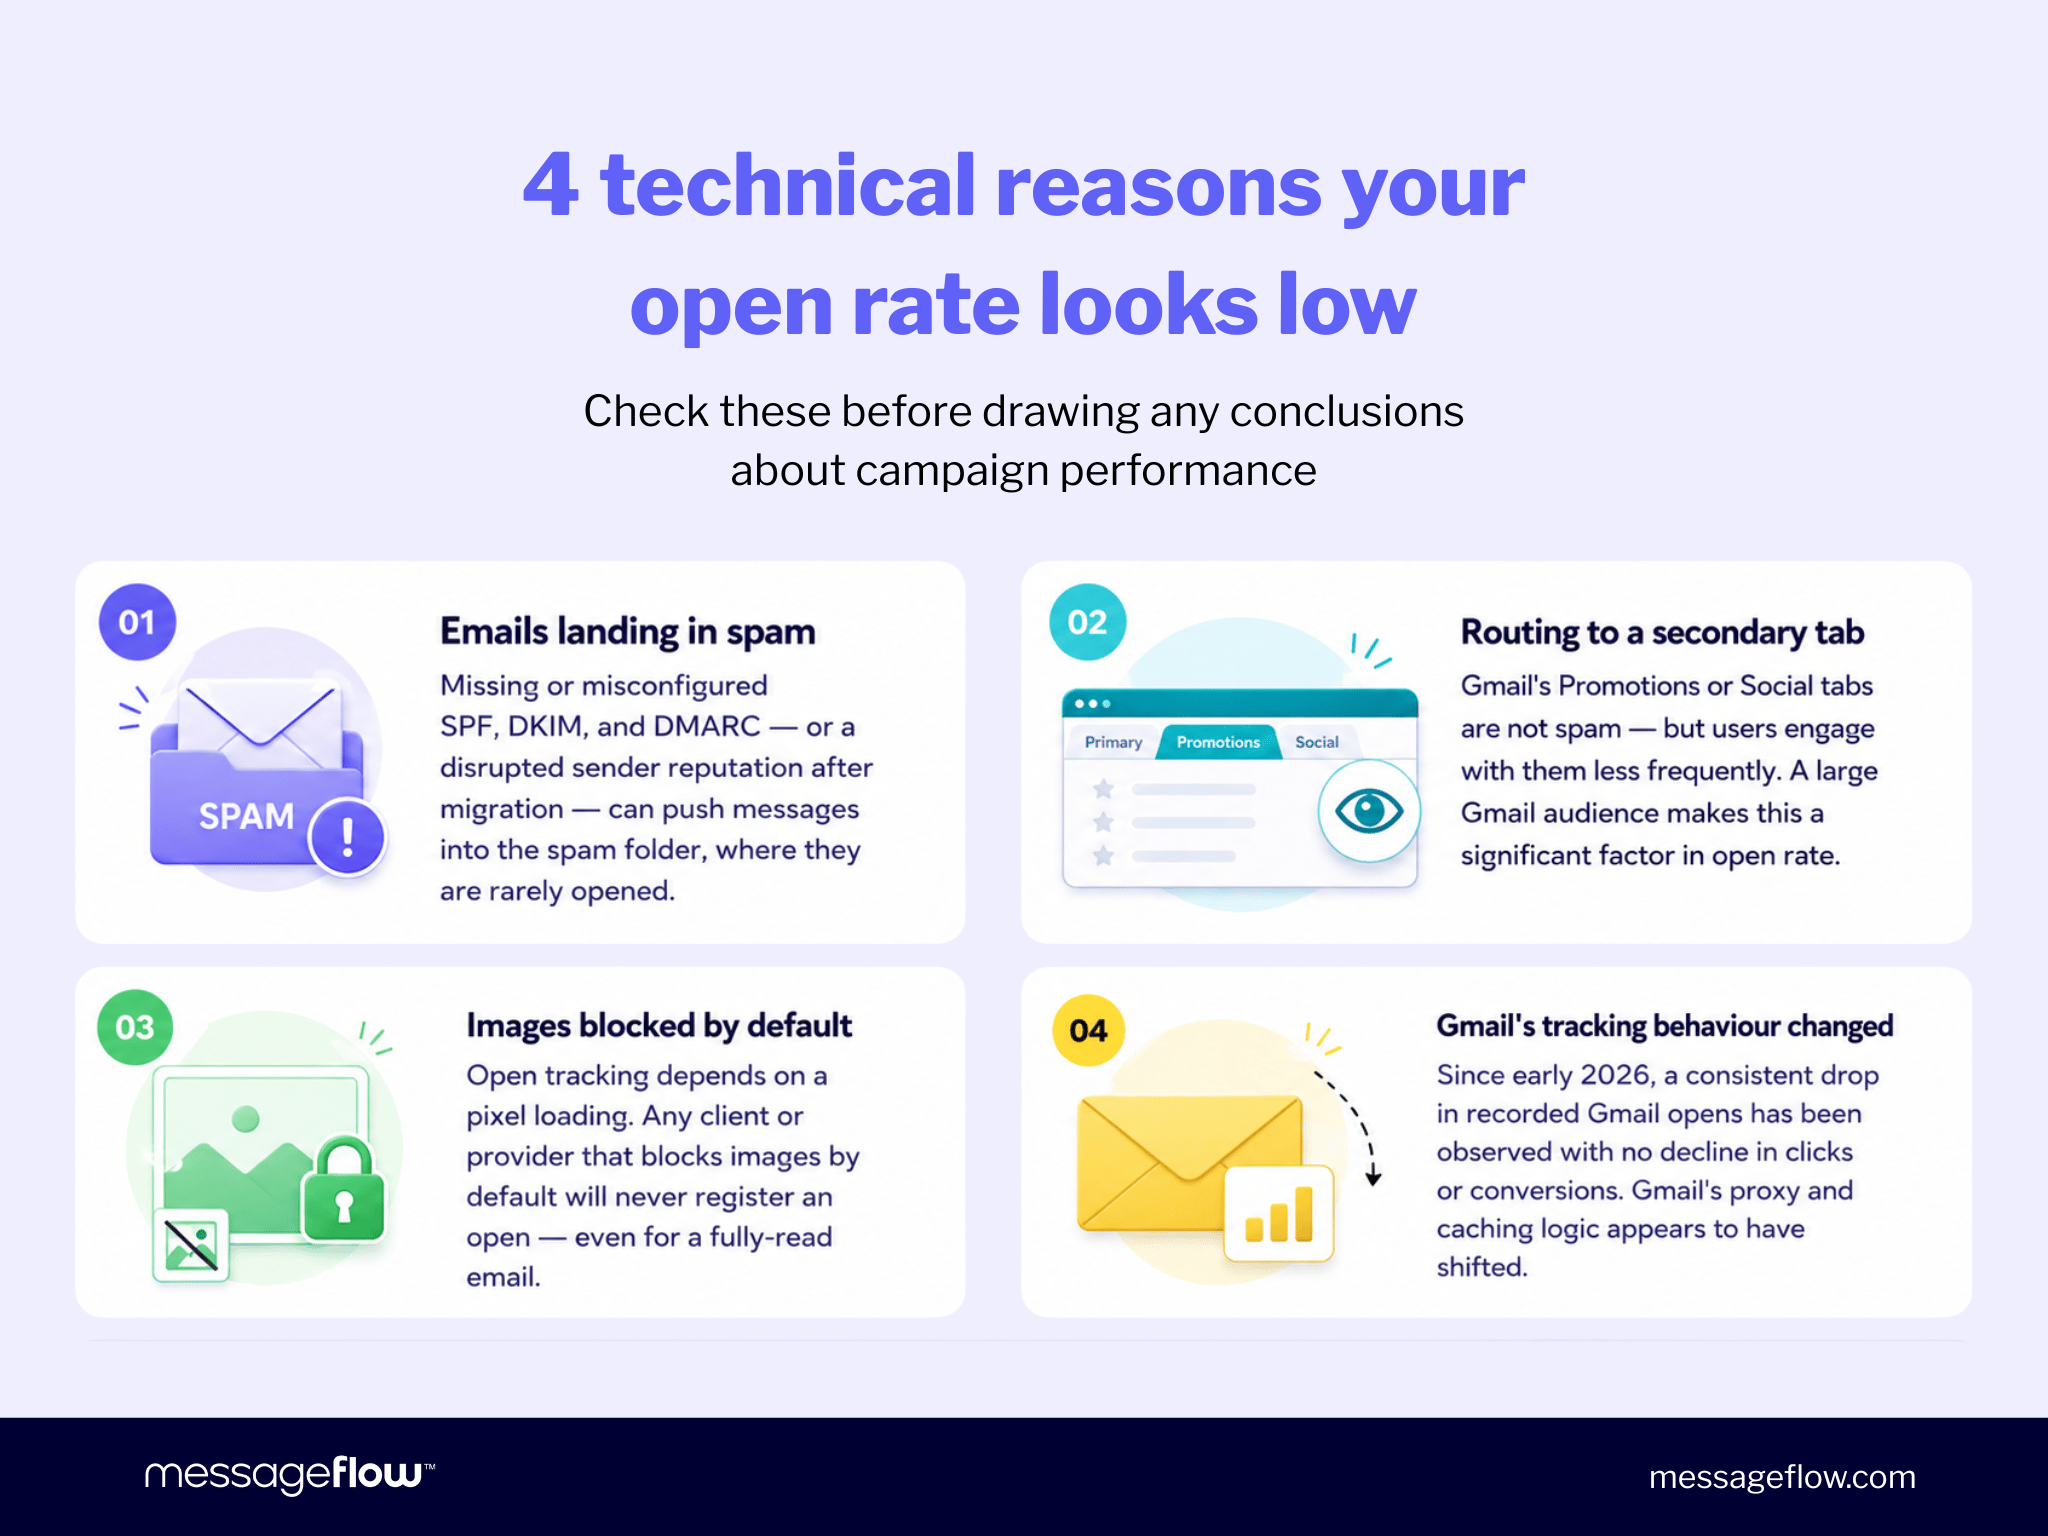
Your emails may be landing in spam
Missing or misconfigured SPF, DKIM, and DMARC records significantly increase email deliverability risk, but authentication alone will not guarantee inbox placement. Mailbox providers also weigh domain reputation, IP reputation, complaint rates, email list hygiene, and sending consistency.
Emails that end up in the spam folder are rarely opened, and those non-opens drag your open rate down directly. This is especially common after a platform migration, when a change in sending infrastructure can temporarily disrupt your sender reputation across all of these dimensions.
Your emails may be routed to a secondary tab
Gmail’s “Promotions” or “Social” tabs are not spam, but they represent a lower-engagement surface. Many users check these tabs less frequently or engage with them more selectively than the primary inbox. If a large portion of your list uses Gmail, tab placement can meaningfully affect your open rate without any real drop in campaign effectiveness.
Some mailbox providers do not load images by default
Since open tracking depends on a tracking pixel loading, any client that blocks images by default will never register an open, even if the recipient reads the email in full. This is not limited to privacy-focused tools; some webmail providers apply this behaviour as a default setting. If a significant portion of your list uses such providers, your open rate will be structurally lower regardless of deliverability or engagement.
Gmail’s recording of opens may have changed
In early 2026, senders across the industry began noticing a consistent drop in recorded Gmail opens, with no corresponding decline in clicks or conversions. The most likely explanation is a change in how Gmail proxies, caches, or preloads the tracking images used to register opens.
When those images are loaded less frequently on Gmail’s side, fewer opens get recorded, even when the email is delivered and read. This is a measurement shift, not an engagement shift.
Your previous platform may have counted opens differently
Different email platforms handle open tracking in different ways. This is particularly true when it comes to filtering bot traffic, deduplicating open events, or classifying Apple Mail Privacy Protection activity. A platform that does not filter MPP prefetches will report significantly higher open rates than one that does, even when sending to the same list with the same content.
If your open rate looks lower after migrating to MessageFlow, the difference may reflect a more precise measurement methodology rather than a drop in actual engagement.
Open rate as a deliverability signal, not an engagement KPI
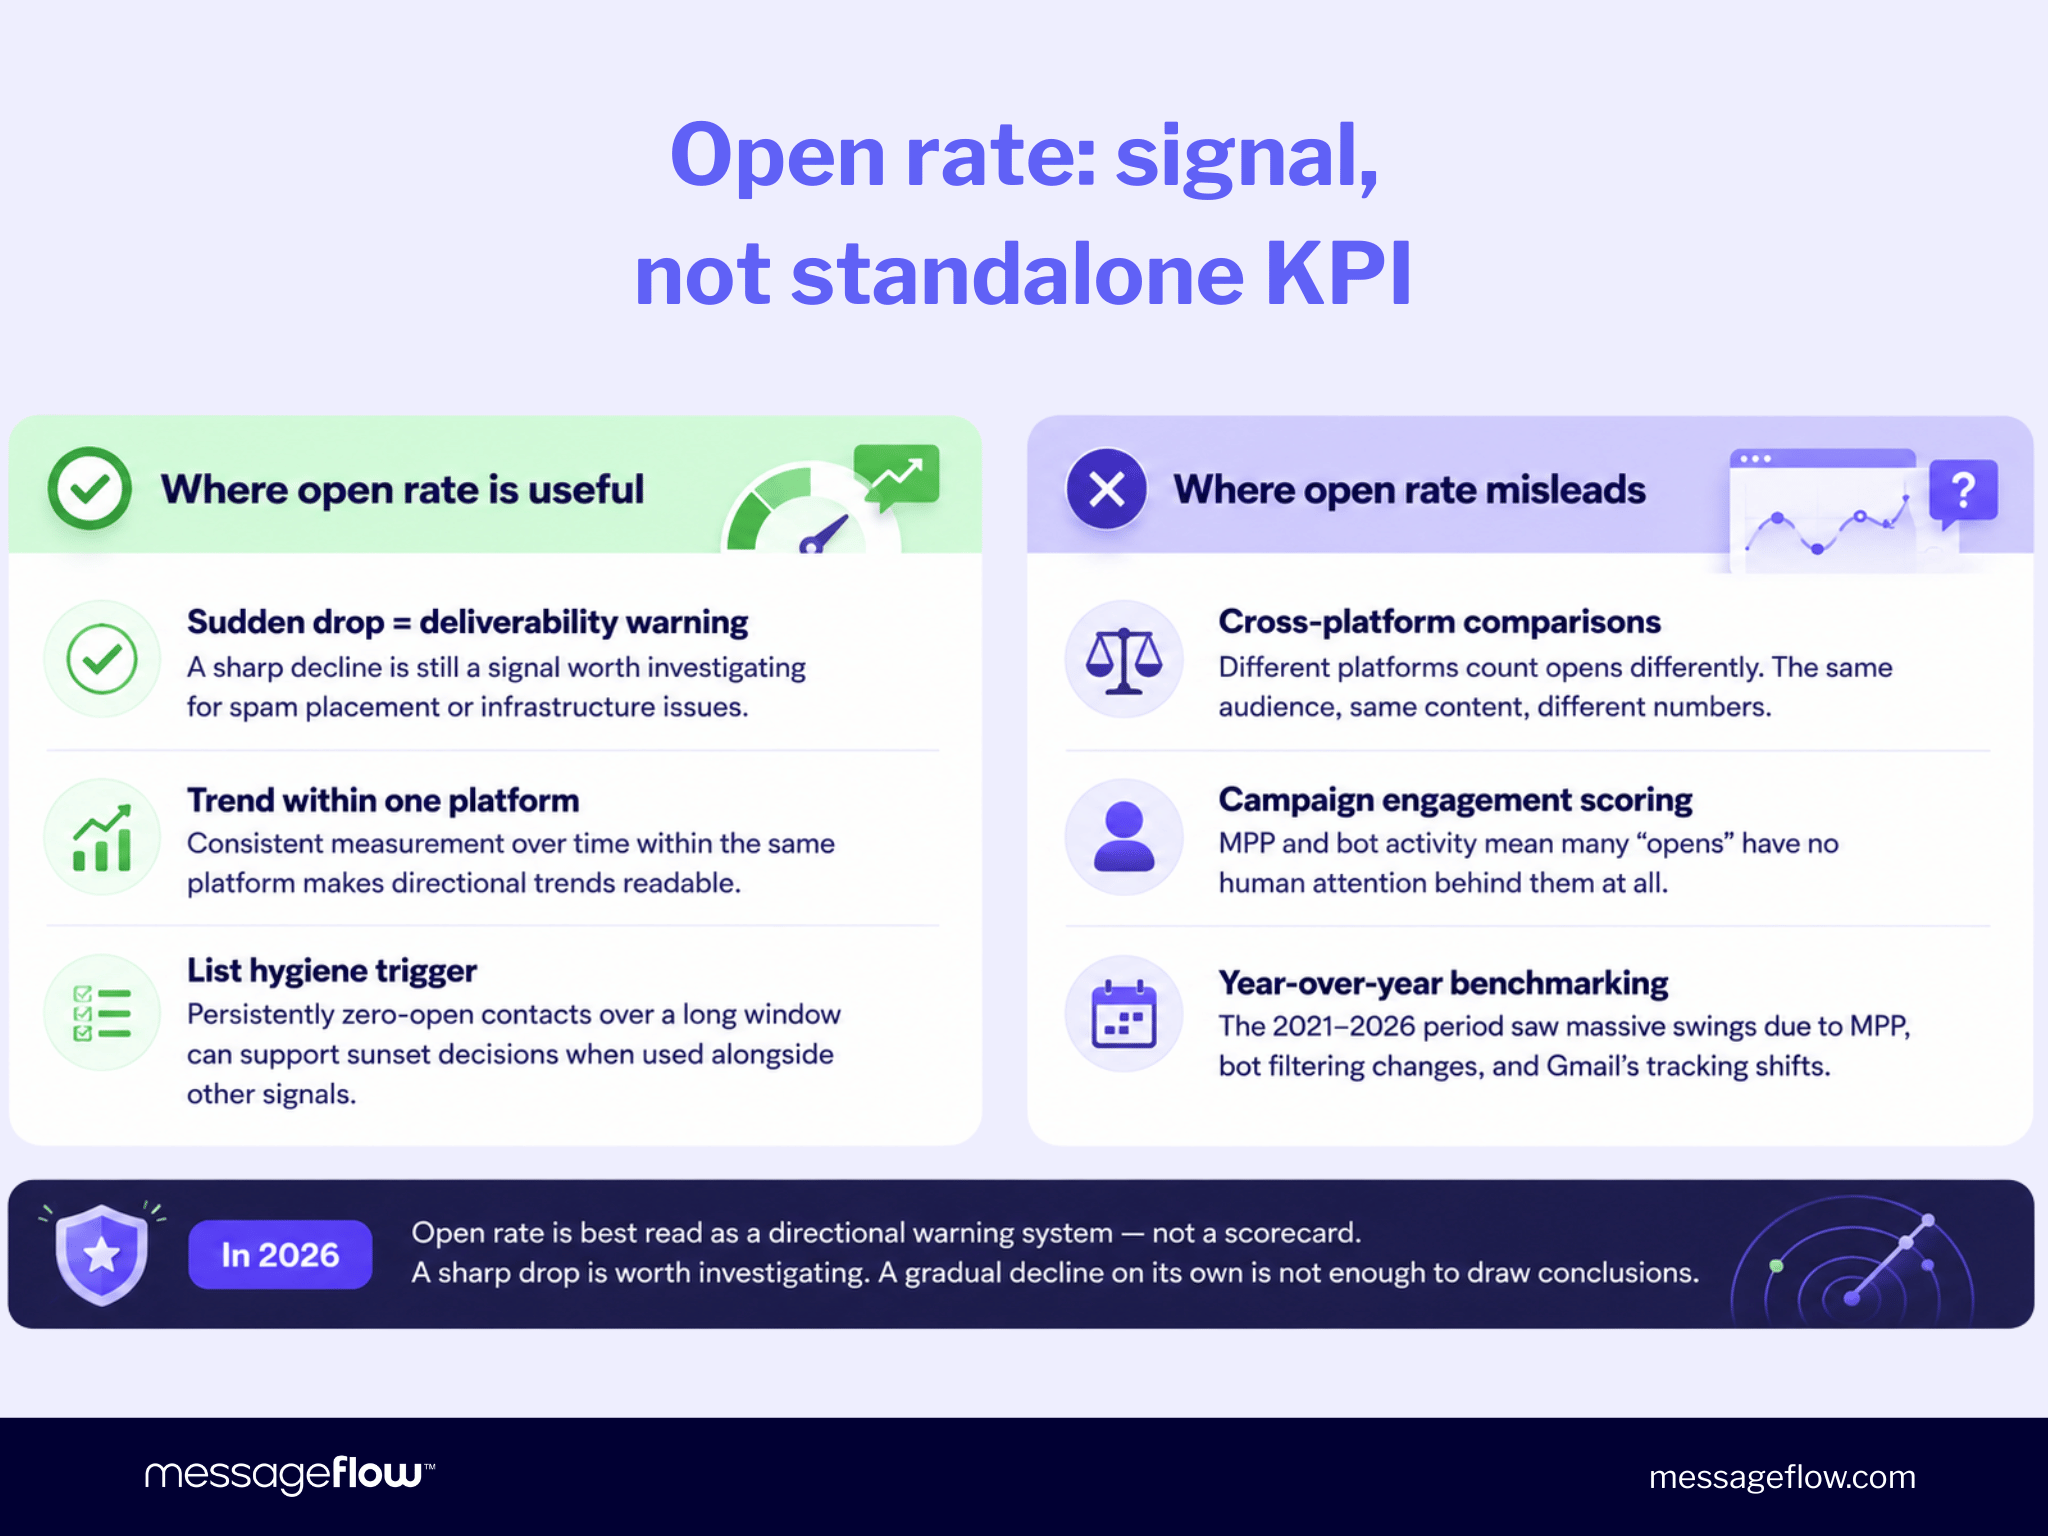
Historically, open rate functioned both as an engagement metric and as a rough deliverability signal. Marketers used it to evaluate subject lines, gauge audience quality, and trigger segmentation. At the same time, a consistently high open rate was a reasonable proxy for good inbox placement. If emails were landing in spam at scale, opens would drop.
Spam placement significantly reduces the likelihood of recorded opens, and a sudden drop in open rate is still a warning sign worth investigating. That logic holds, but only partially. The environments that affect open tracking have multiplied, and the signal has become harder to interpret cleanly.
Your open rate now tells you something, but not enough to act on alone. Some opens are generated without human attention, while some real engagement happens without any recorded open at all. And even setting aside tracking accuracy, comparing open rates between campaigns is rarely straightforward: a promotional offer sent to a perfectly targeted audience segment will naturally achieve better results than a routine newsletter sent to a broad list, regardless of campaign quality.
Send time, subject line, audience size, and segment composition all affect the number directly. In 2026, open rate is best interpreted as a directional signal, not a standalone KPI.
Factors that distort open rate data
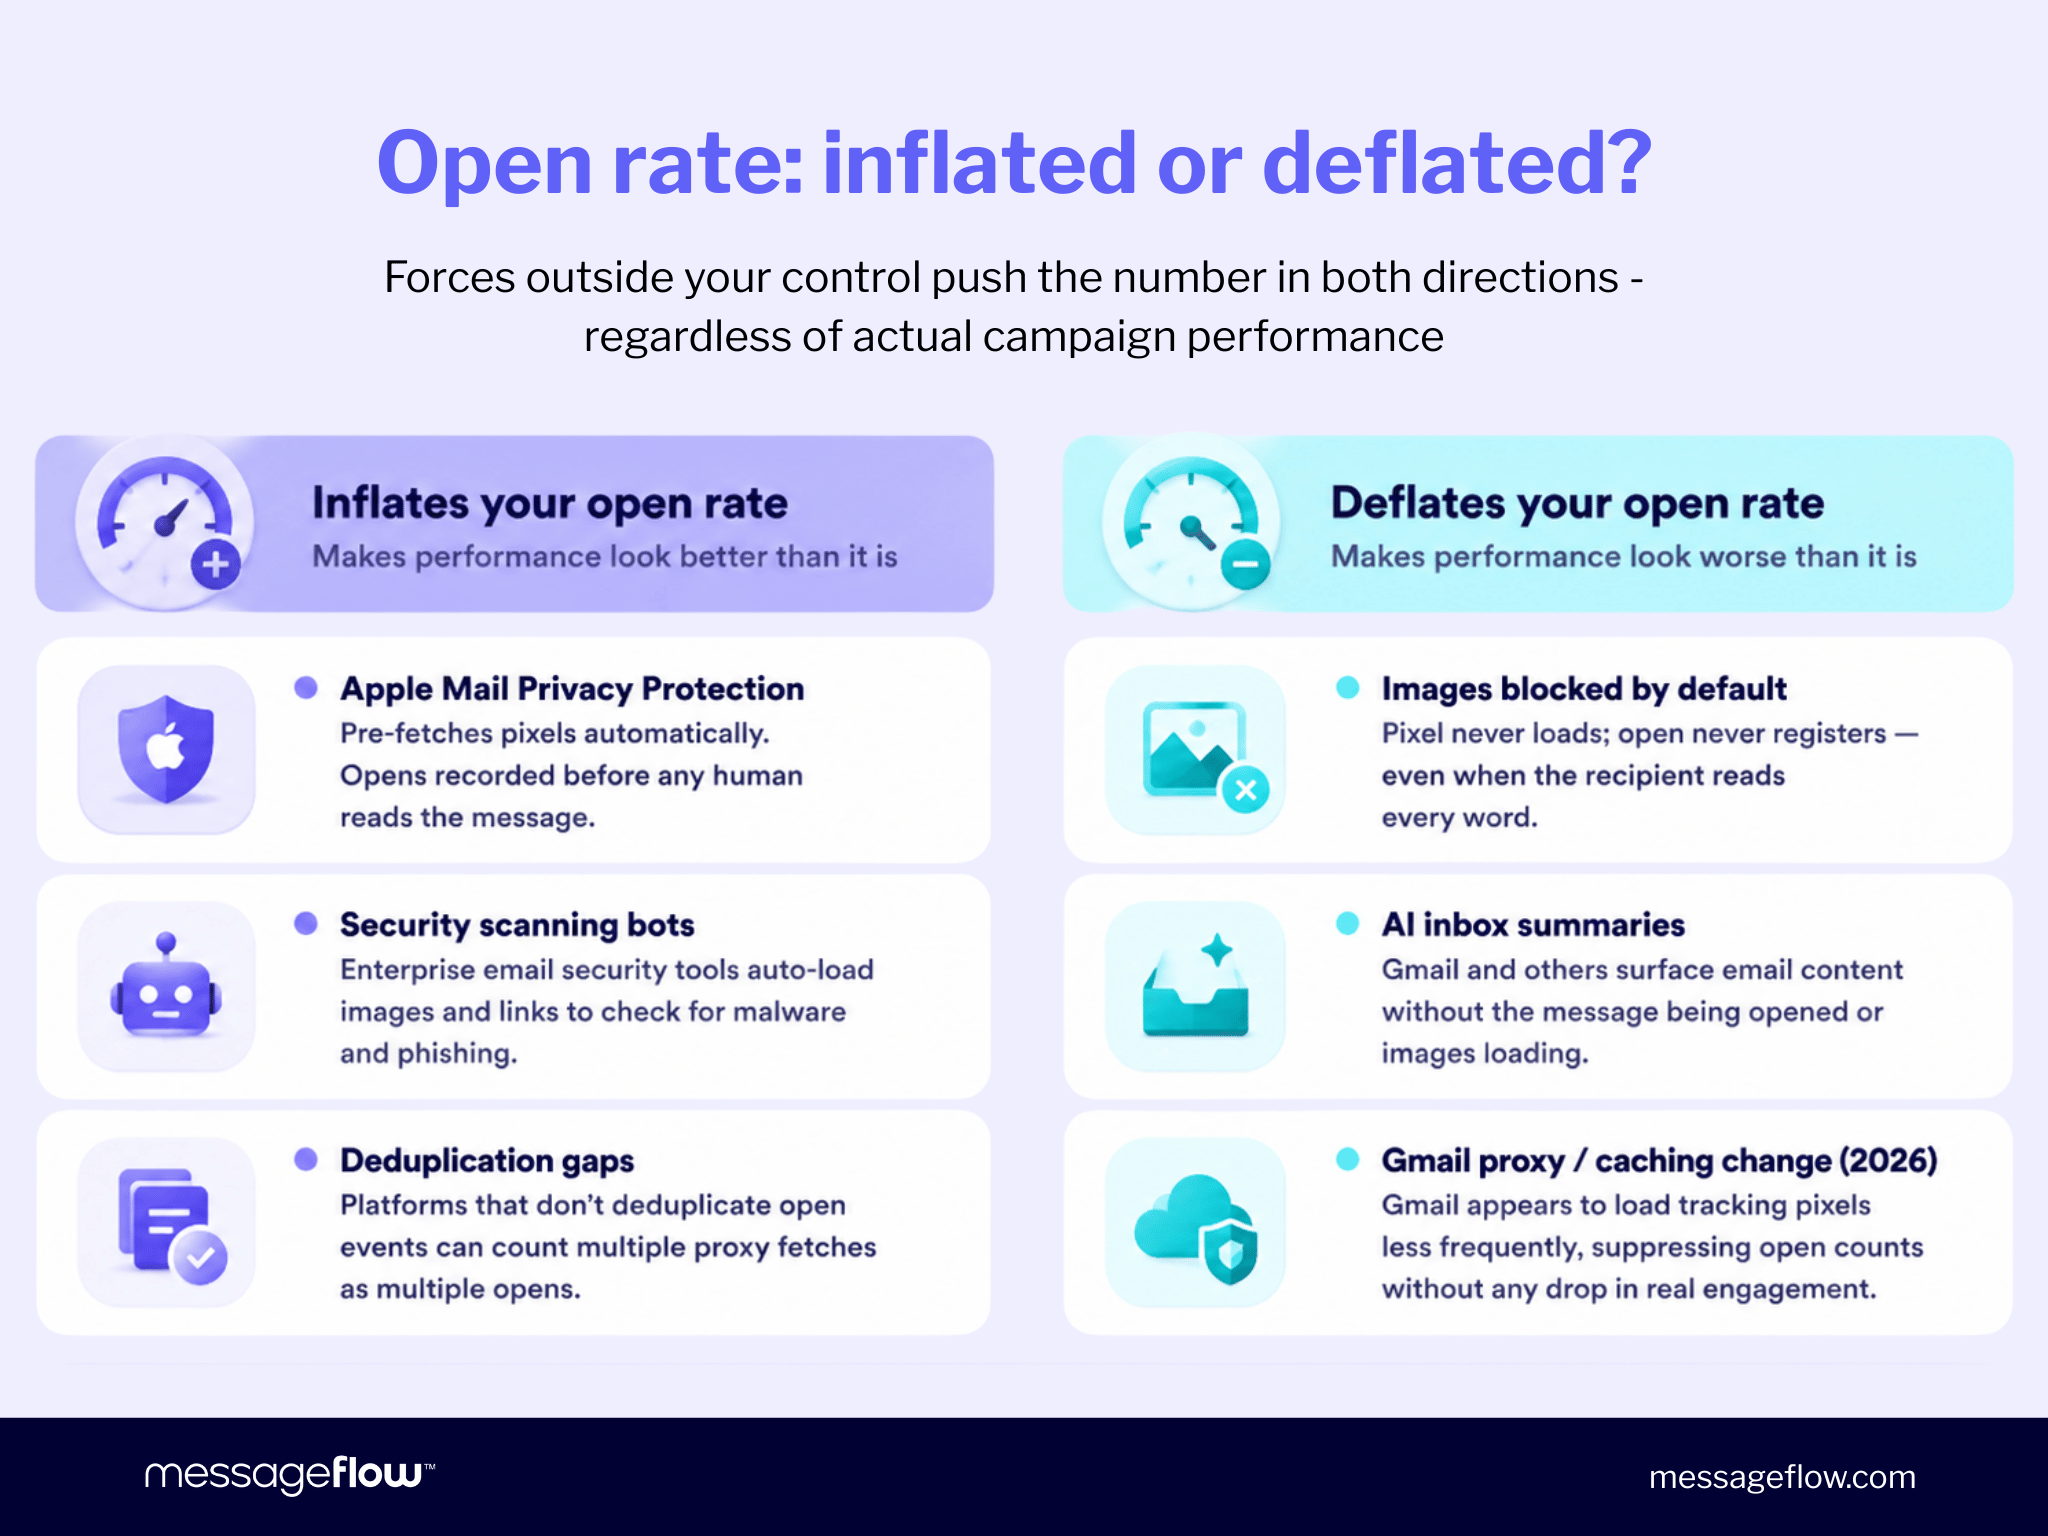
Even if your emails are delivered perfectly, your open rate can be inflated or deflated for reasons entirely outside your control.
Apple Mail Privacy Protection (MPP)
Introduced in 2021, MPP pre-fetches email images on Apple’s own servers before the user ever opens a message. The tracking pixel fires, the open gets recorded, but no real human may have read a word. In Apple-heavy audiences, a substantial share of recorded opens may originate from Apple’s proxy infrastructure rather than direct user interaction.

Security bots and spam filters
Many enterprise email security tools scan incoming messages by automatically loading images and clicking links. These automated interactions register as opens and clicks in your reporting, even though no one engaged with your email. Many modern email platforms attempt to filter this activity, but detection is imperfect and methodologies vary between providers.
AI-powered inbox summaries
Gmail and other clients are increasingly summarising email content directly in the inbox view. A user may consume part of the message without generating an open at all, further weakening the connection between open rate and actual attention.
In practice, open rate has become a blended signal influenced as much by technical infrastructure as by human behaviour.
What to measure instead (or alongside)
Open rate still has value as a directional indicator. A sudden, sharp drop is still a signal worth investigating for deliverability issues, but it should no longer be your primary email marketing KPI. Here is what you should track instead.
Conversions
Revenue and conversions are imperfect but materially closer to business impact than open tracking. Email often contributes to a conversion without closing it directly, so attribution is not always clean. However, downstream business outcomes remain far more meaningful than opens.
Website traffic from campaigns
UTM parameters and Google Analytics will tell you how many people clicked through and what they did on your site. This is more closely tied to observable user behaviour than pixel-based open tracking.
Click-through rate (CTR)
CTR is a stronger engagement signal than opens, though security bots can inflate click data too (particularly in B2B environments). Use it as one signal among several, not as a standalone truth.
Revenue per email
Unlike opens, revenue per email is much less affected by mailbox provider behaviour or tracking methodology differences between platforms. That makes it a more stable and comparable measure across campaigns and sending environments.
Deliverability health metrics
Spam complaint rates, unsubscribe rates, bounce rates, and inbox placement often provide a clearer picture of email programme health than opens alone. For larger sending programmes, inbox placement testing and seed-list monitoring can provide a particularly reliable deliverability signal.
This signal does not depend on recipient behaviour or tracking pixel accuracy at all. If these signals are stable, a lower open rate is unlikely to indicate a structural problem.
💡 In MessageFlow, deliverability health metrics are available directly in the panel. E-mail Campaign module users can find them in Campaign Reports, including opens over time and activity distribution within the 24 hours following a send.
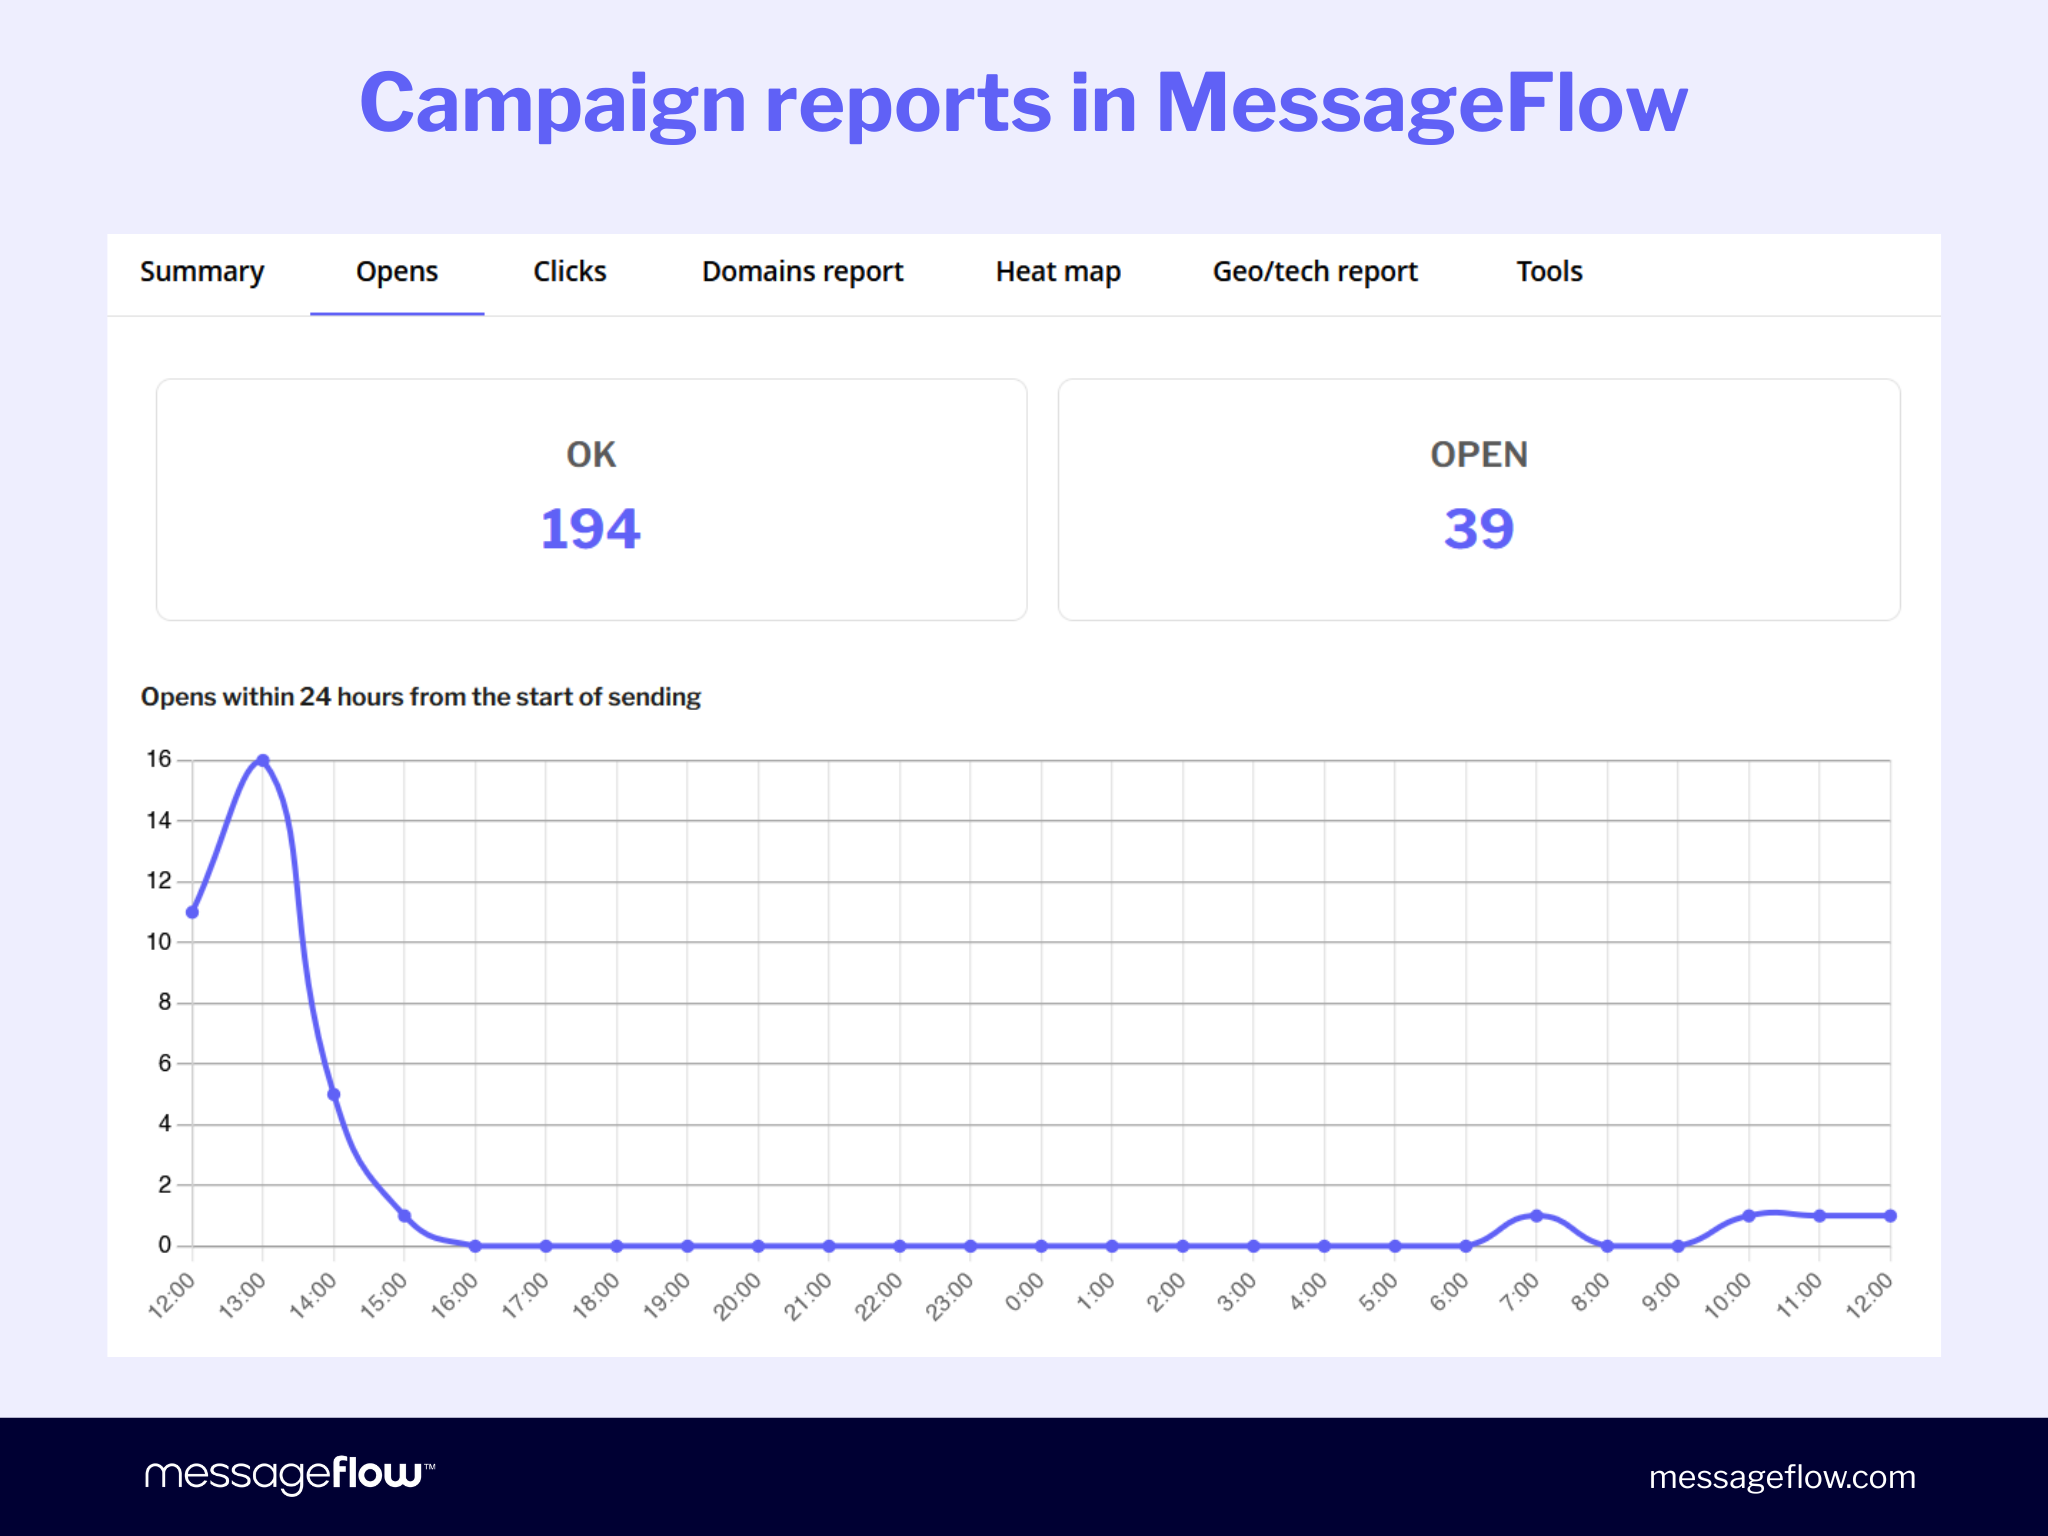
The opens-over-time chart is particularly useful as a deliverability signal: a sudden absence of activity in the first hours after a send can suggest inbox placement issues, even if the overall open rate figure looks normal.
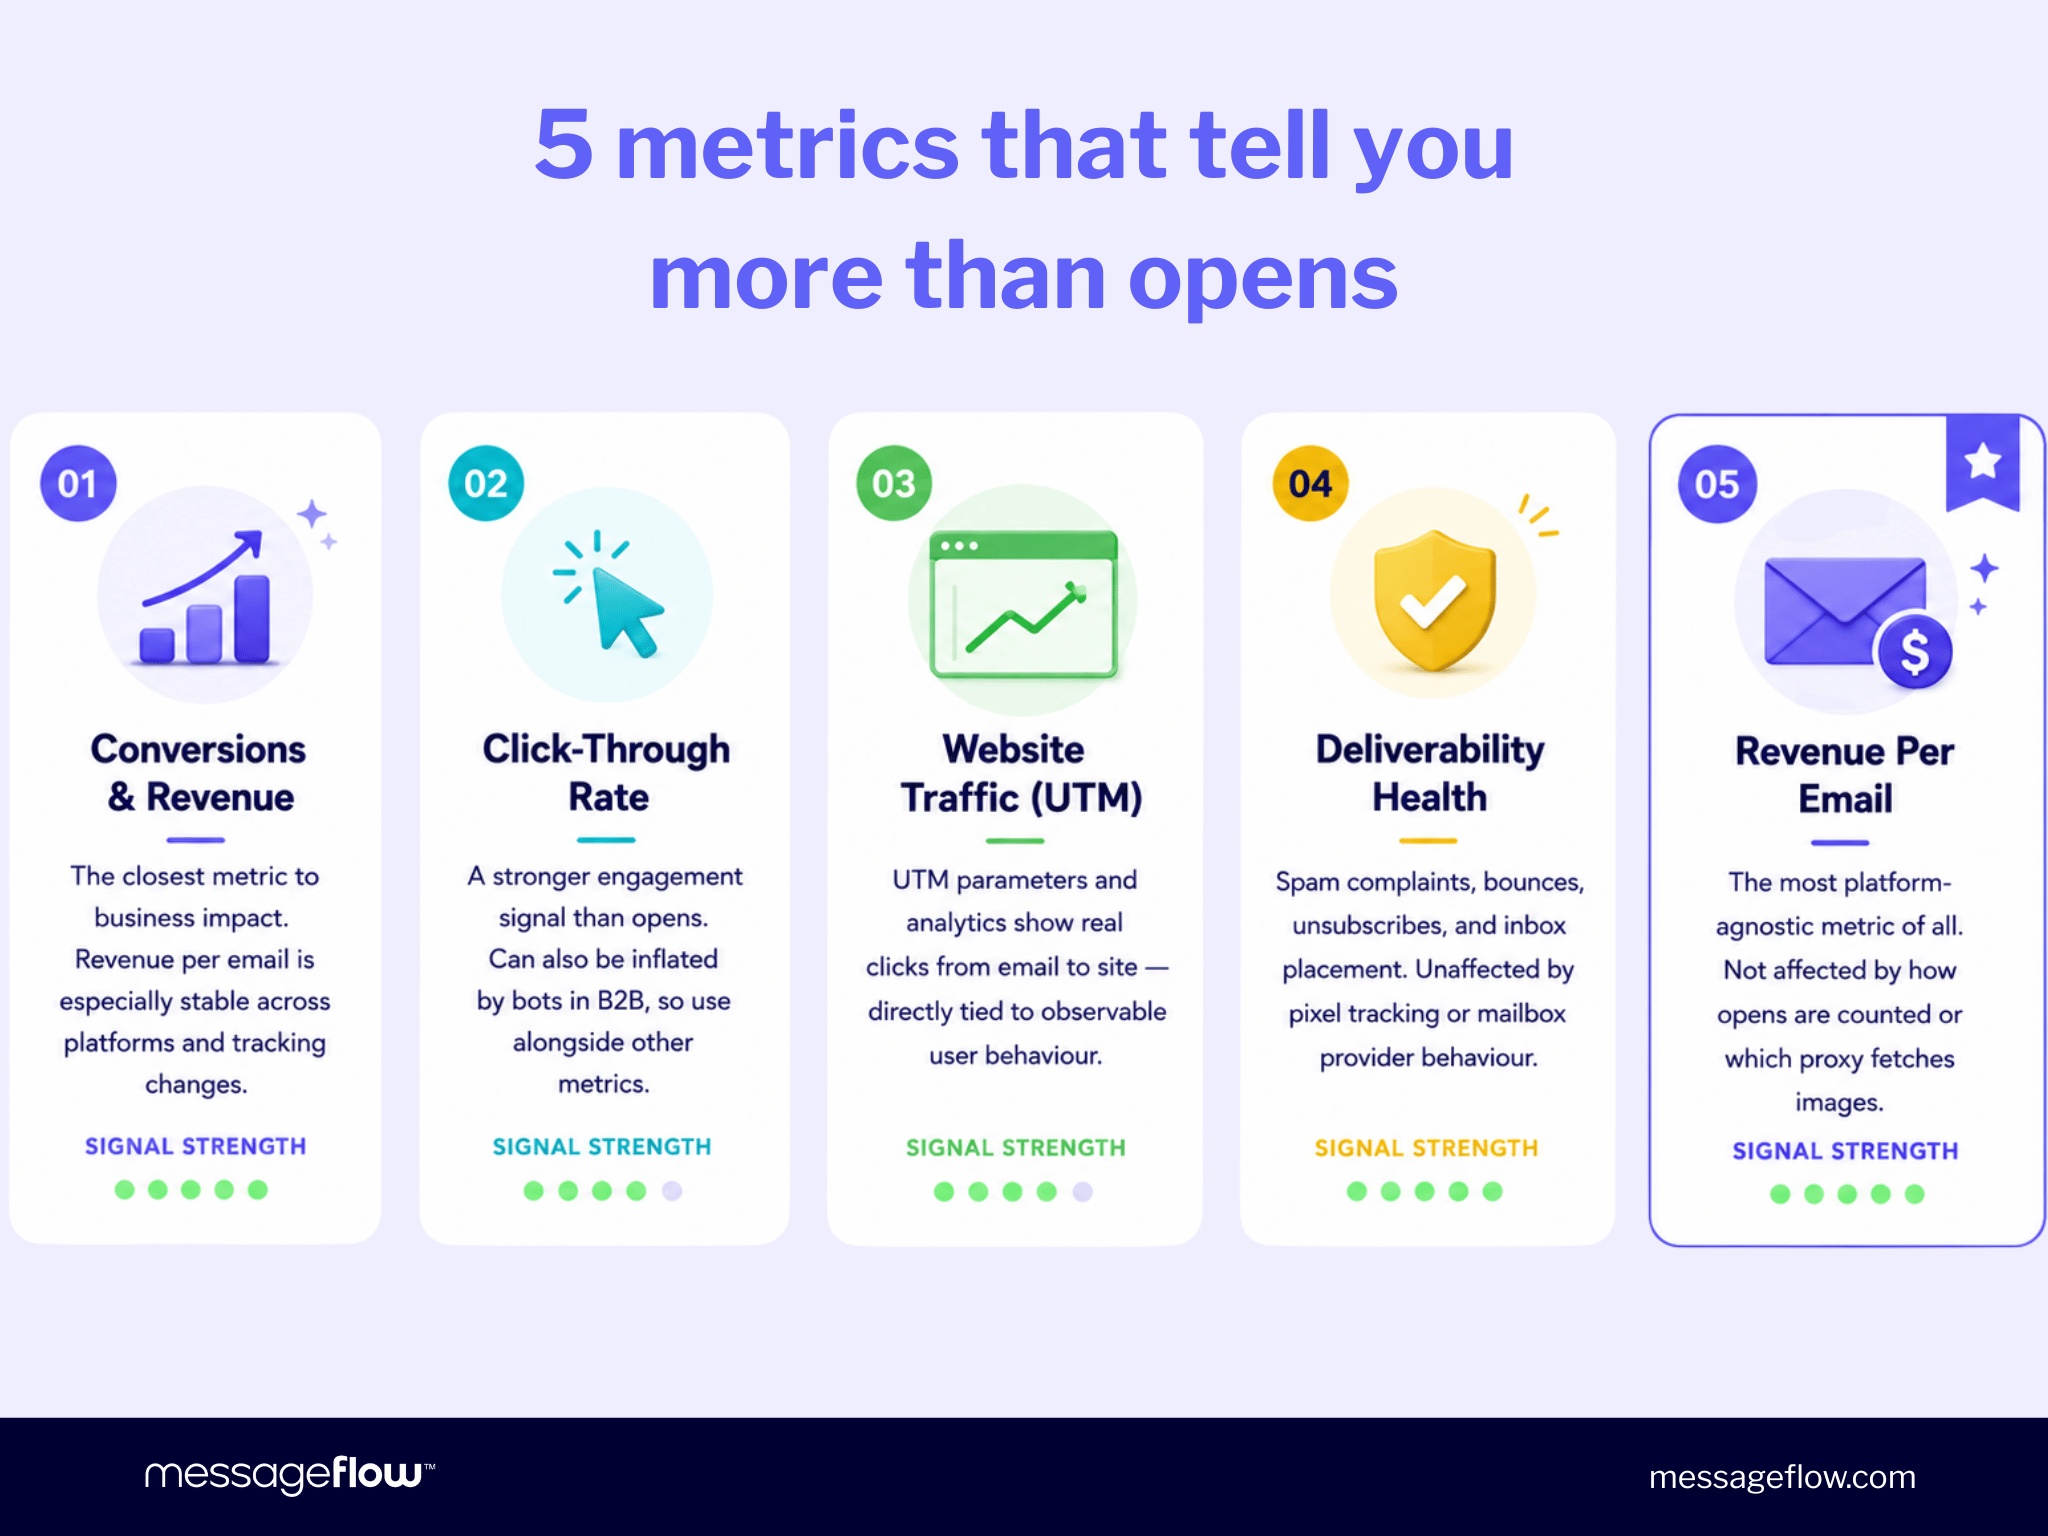
The underlying principle is that no single metric tells the full story. In 2026, email performance is best assessed by reading several signals together rather than optimising for any one of them.
Why email open rates have become less reliable over time
These changes affect senders across the entire email ecosystem. The trend has been building since at least 2021, but the story is not simply that open rates have been falling. Industry data from the period 2021–2026 reflects exactly this instability.
Reported averages swung sharply as MPP inflated figures, platforms began filtering bot activity, and Gmail’s tracking behaviour evolved. The numbers moved, but they moved differently for every sender.
Apple’s MPP rollout initially inflated reported opens for many senders, particularly those with a large Apple Mail audience. As platforms began filtering MPP activity and Gmail’s tracking behaviour evolved, those initial spikes gave way to significant measurement instability.
Privacy regulations, the spread of security scanning tools, and growing bot filtering across email providers have all added further layers of complexity. As a result, comparing open rates across years, mailbox providers, or even different email platforms has become increasingly unreliable.
What you are seeing in 2026 is the accumulated effect of privacy protections, inbox automation, security filtering, and changing tracking methodologies across the email ecosystem. These are structural shifts, not anomalies. They affect every sender, regardless of platform or sending practices.
The regulatory angle: open tracking is now a legal question in Europe
The erosion of open rate reliability is not just a technical story. It is becoming a legal one too.
In April 2026, France’s data protection authority (CNIL) published guidance treating individual email open tracking under rules similar to those already applied to cookies and other tracking technologies.
Italy’s Garante followed within days with its own guidelines. The regulators’ position is that consent to receive an email does not automatically imply consent to behavioural tracking inside that email.
Here are a few practical consequences worth knowing about:
- Consent to receive marketing email is not the same as consent to be tracked, which means your current double opt-in flow may not cover it.
- The guidance raises difficult questions around how tracking consent withdrawals should be enforced, including for previously delivered messages.
- B2B emails are not exempt.
- The standard ESP engagement log (storing every open event across months or years) may be non-compliant even under the narrow deliverability exemptions the CNIL carved out.
There are two deliverability exemptions where consent is generally not required: security and authentication measures, and the use of the last-open date (not timestamp) for cleaning inactive contacts from transactional email lists.
Regulators generally indicate that use cases such as engagement-based segmentation, send-time optimisation, and personalisation are likely to require explicit consent.
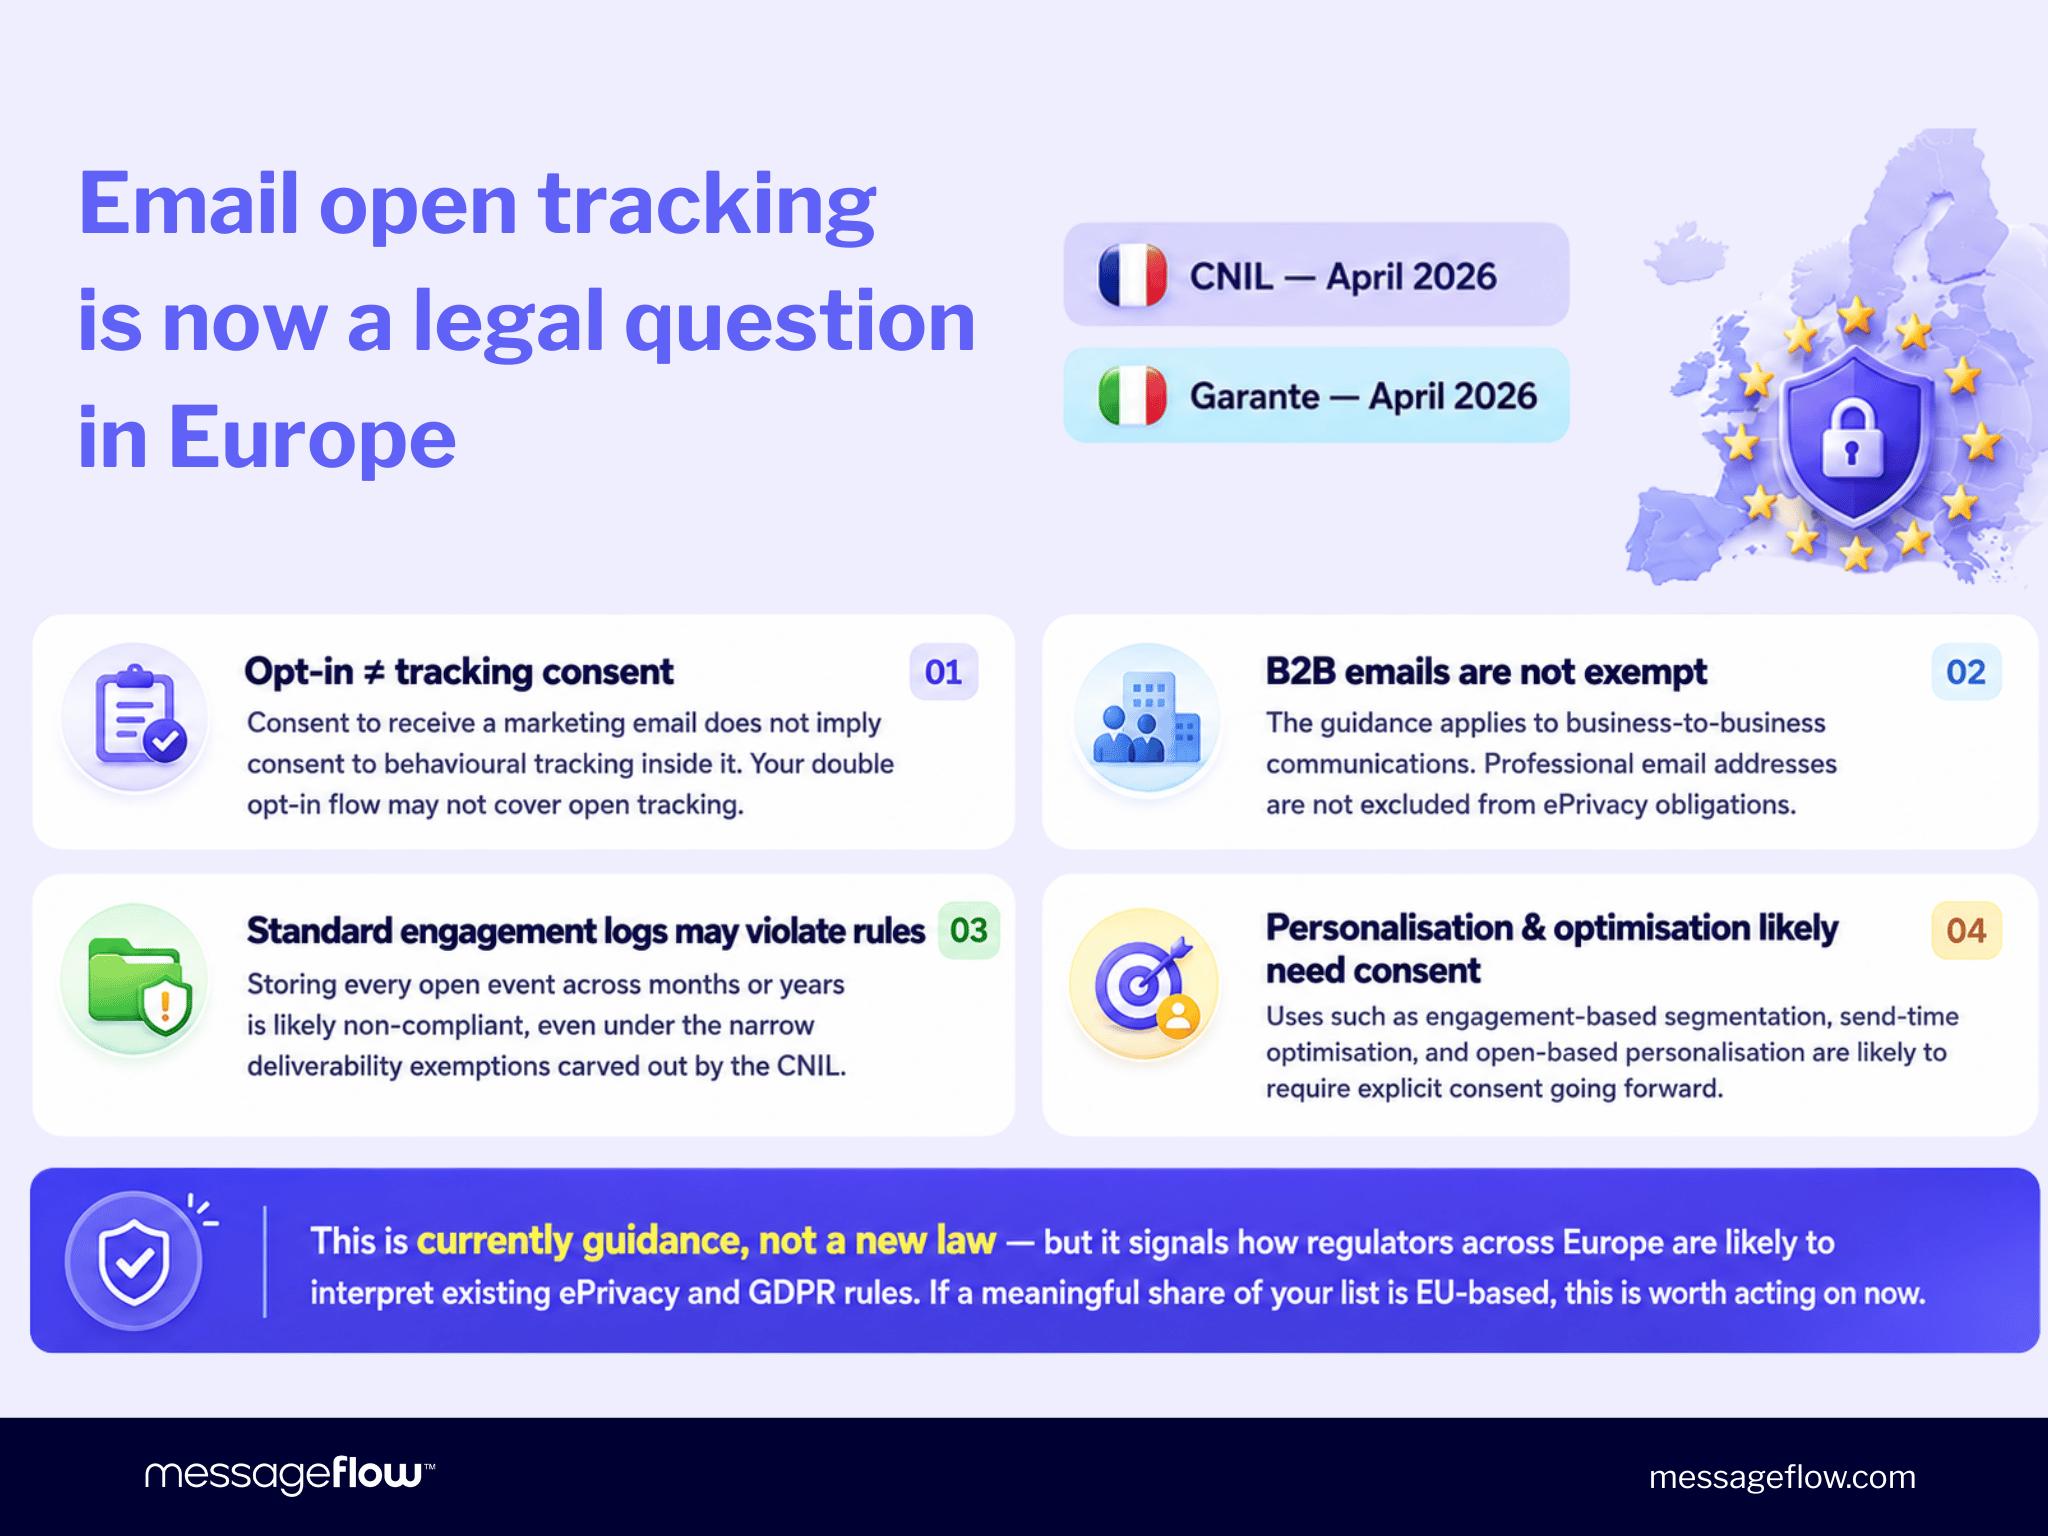
This is currently guidance, not a new law, and it applies directly in France and Italy. However, it signals how regulators across Europe are likely to interpret existing ePrivacy and GDPR rules. If a meaningful share of your list is EU-based, this is worth taking seriously now.
For email marketers, this adds another reason to move away from open rate as a primary metric. The regulatory environment is pointing in the same direction as the technical one.
A note on platform migrations
With both technical infrastructure and legal frameworks shifting, accurate and transparent measurement is more important than ever. Because the email ecosystem is so fragmented, email service providers have had to develop their own ways of handling these new challenges. This is why evaluating your metrics during a platform change requires a nuanced approach.
If you’ve moved to MessageFlow from another platform and your open rate looks different, this comparison may not be as alarming as it seems. Different platforms apply different methodologies for bot filtering, open deduplication, Apple MPP classification, and image-proxy handling. Some include all automated activity in their reported figures; others apply stricter filtering. A lower number on one platform may actually be a more accurate number.
Open rate is most useful when analysed as a directional trend within a consistent measurement environment. Cross-platform comparisons, or comparisons across periods where tracking methodologies have changed, rarely tell you what they appear to tell you.
If you are seeing a drop that looks like a genuine deliverability issue rather than a measurement shift, MessageFlow can support you with deliverability diagnostics, authentication setup, and sender reputation monitoring.
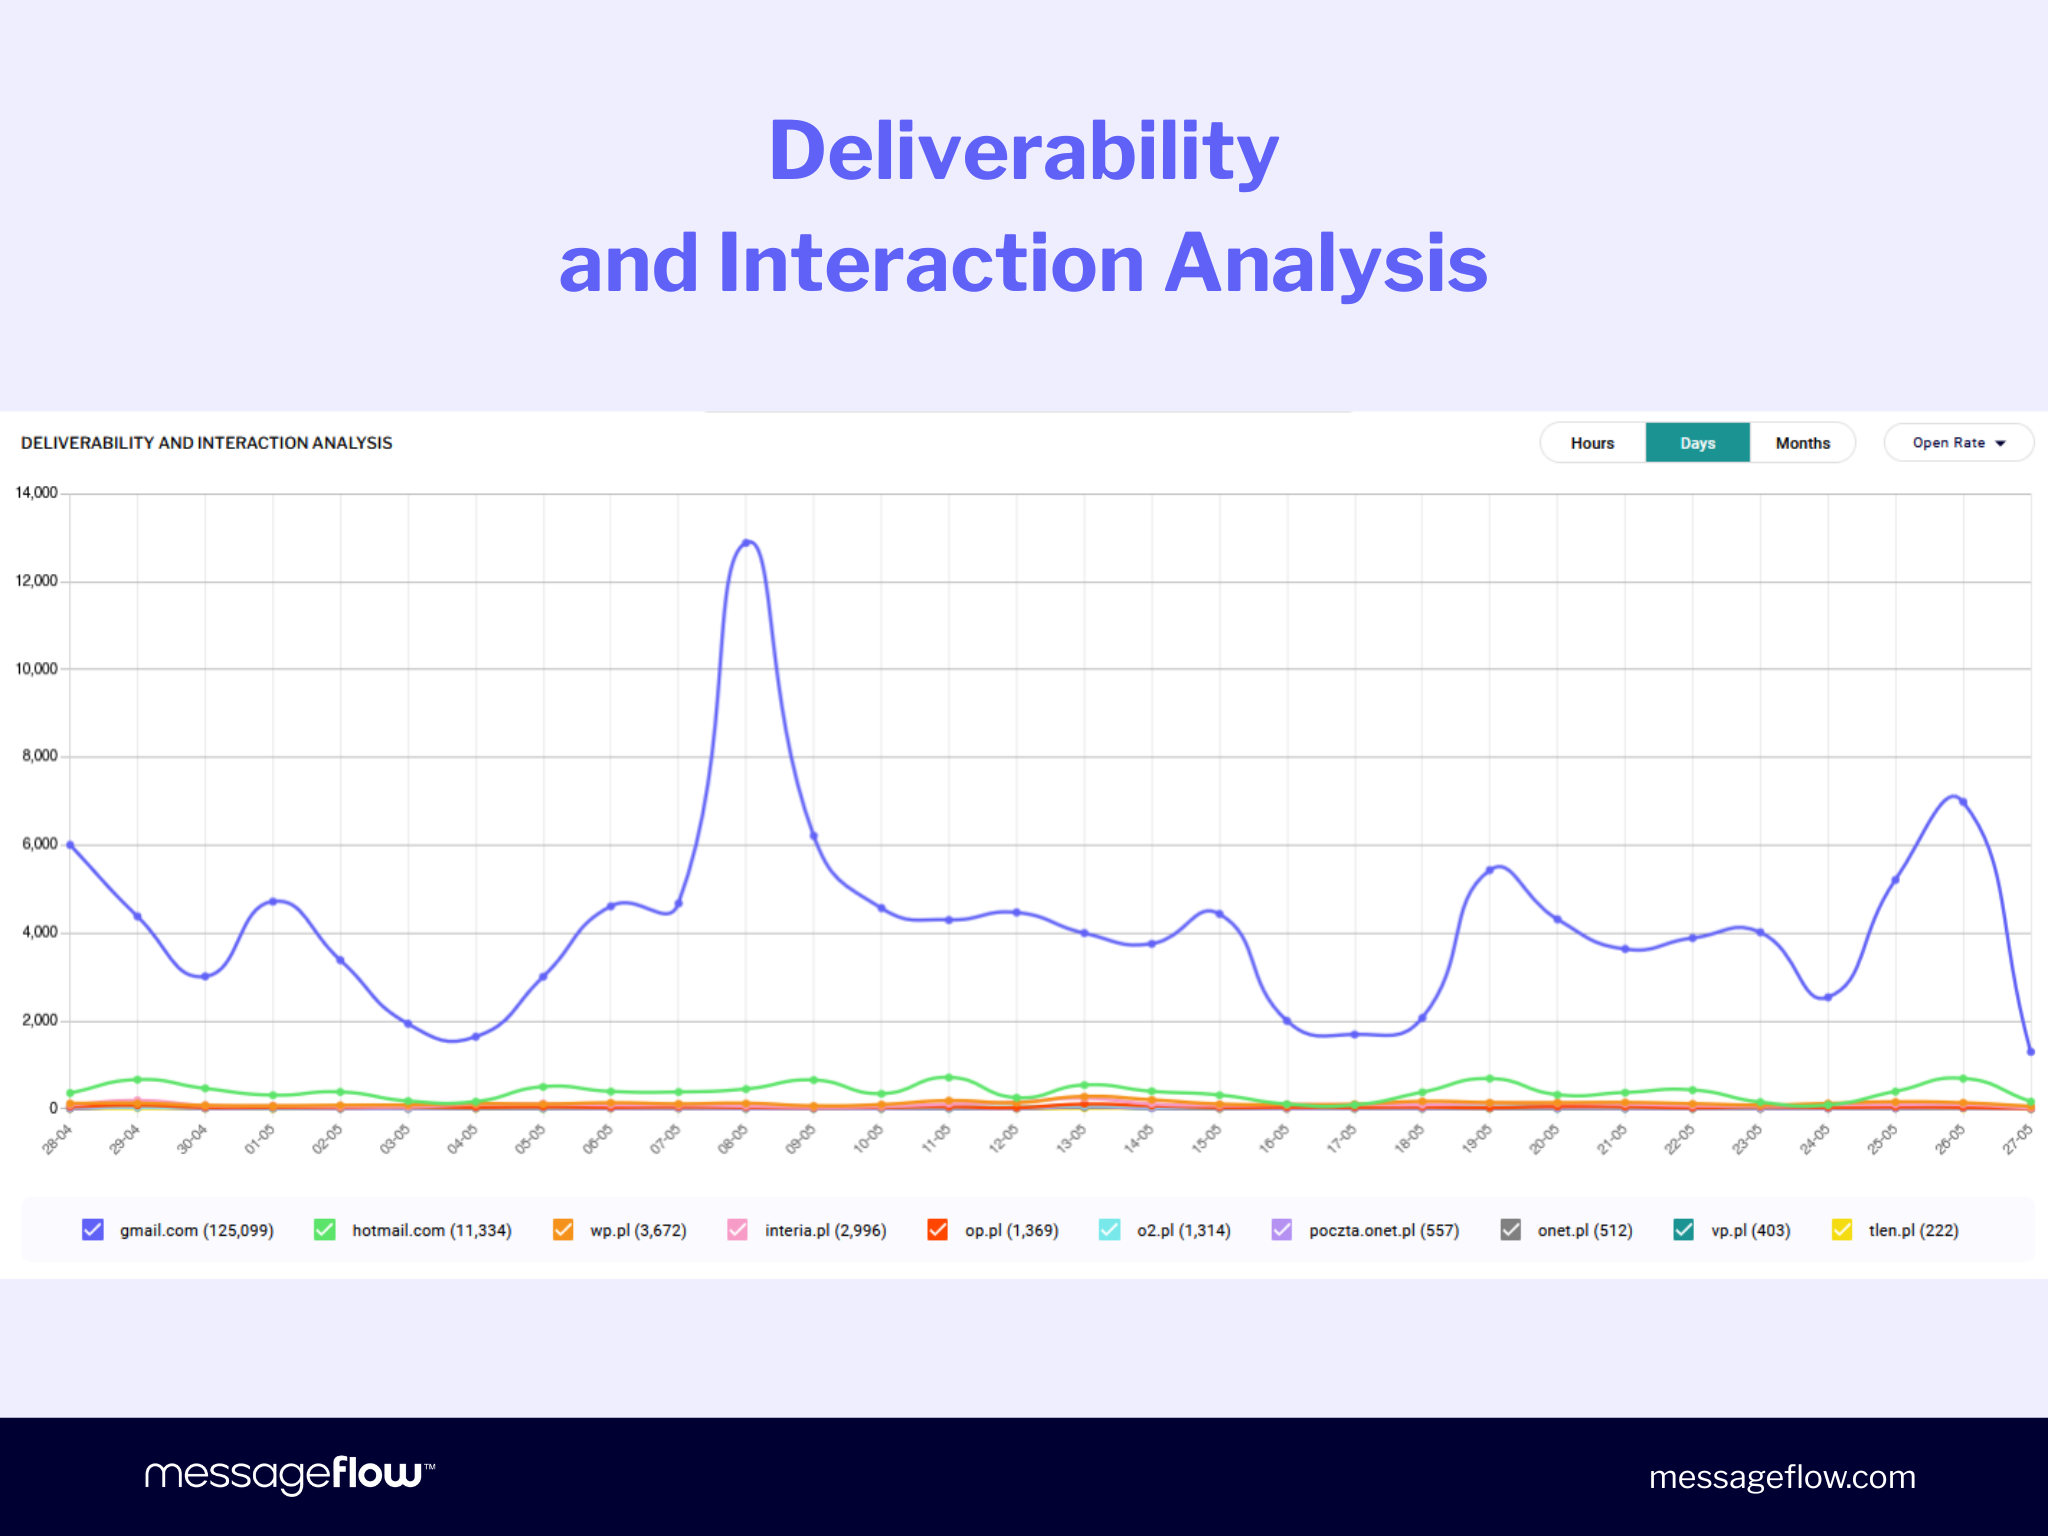
Email API module users can access Email API Analytics (available as an add-on), which breaks down open rate by mailbox provider. This makes it easy to check whether a change in your stats affects all providers at once or just specific ones. If a drop is visible only in Gmail but not in other providers, it likely reflects a shift in Gmail’s tracking methodology rather than a genuine deliverability problem.
💡 If your open rate changed after a migration, we can help determine whether you’re looking at a deliverability issue, a tracking methodology difference, or simply a healthier measurement model. Contact our Support Team or explore our blog to learn more.
Frequently asked questions about low email open rate
Not necessarily. A low open rate can reflect a genuine deliverability issue, but it can also result from tracking methodology differences, mailbox provider behaviour changes, or audience composition. Check whether other signals (such as click-through rate, conversions, or spam complaint rate) are also declining. If they are stable, the drop is more likely a measurement issue than a campaign problem.
Different platforms apply different methodologies for filtering bot activity, classifying Apple MPP prefetches, deduplicating open events, and handling image-proxy traffic. A platform that applies stricter filtering will naturally report lower open rates than one that counts all automated activity. This does not mean your campaigns are performing worse. It may mean your data is more accurate. Cross-platform open rate comparisons are rarely reliable for this reason.
Yes. Apple’s MPP, introduced in 2021, pre-fetches email images on Apple’s servers before a user opens a message. This causes the tracking pixel to fire (and an open to be recorded) without any direct user interaction. In audiences with a high proportion of Apple Mail users, a substantial share of reported opens may originate from Apple’s proxy infrastructure rather than from genuine engagement.
The most reliable indicators are conversions, revenue per email, click-through rate, and website traffic via UTM tracking. For deliverability health, spam complaint rates, unsubscribe rates, bounce rates, and inbox placement data are more useful than open rate alone. The clearest picture comes from reading several signals together.
Yes, and this is increasingly common. Open tracking relies on a tracking pixel loading inside the email. If images are disabled, if the email is previewed in a client that does not load images, or if an AI-generated inbox summary surfaces the content without the full message being opened, no open event is recorded. This happens even though the recipient has engaged with the content. This means open rate can undercount real engagement just as easily as it can overcount it.
There is no universal benchmark. Open rates vary significantly by industry, audience, sending frequency, and crucially, by how each platform measures them. Given the distorting effects of MPP, bot filtering, and changing mailbox provider behaviour, cross-sender comparisons have become increasingly unreliable.
A more useful question is whether your own trend line is stable and whether your downstream metrics (conversions, revenue, deliverability signals) are healthy.
Email API module users can access Email API Analytics (available as an add-on), which breaks down open rate by mailbox provider. This makes it easy to check whether a change in your stats affects all providers at once or just specific ones. If a drop is visible only in Gmail but not in other providers, it likely reflects a shift in Gmail’s tracking methodology rather than a genuine deliverability problem.