The 98% open rate stat keeps showing up time and time again in articles about SMS marketing benchmarks. It’s impressive on a slide deck, but it won’t tell you whether your own campaigns are performing well or underdelivering. Truth be told, open rate alone isn’t an actionable metric for SMS and the number itself comes with caveats sources conveniently skip over.
Here’s what’s more useful as a starting point. Average SMS CTR sits between 18% and 35% depending on industry and campaign type. Conversion rates for well-optimized programs land at 21-30%, roughly double what email achieves.
But those ranges are wide enough to be misleading without context. A promo blast and a triggered cart abandonment SMS live in completely different performance brackets, even though both get labeled “SMS campaign” in benchmark reports.
In this guide I break down the numbers by metric, industry, and campaign type with a clear distinction between what’s measurable and what’s estimated. Alongside the benchmark data, we’ve also tapped MessageFlow’s own Paulina Gorczyca (Head of Sales) for a practitioner’s take on costs and ROI.
The 5 metrics that actually define SMS campaign performance
SMS marketing has fewer metrics than email or paid ads, which makes reporting simpler but also makes it easy to fixate on one number that doesn’t reflect what you’re actually trying to improve. Here’s what each metric tells you, what it doesn’t, and where the benchmarks sit.
Delivery rate – the baseline before anything else
Delivery rate measures the percentage of messages that actually reach the recipient’s device. A strong delivery rate benchmark is 95%+. Anything below that points to list quality problems – invalid numbers, inactive subscribers, or formatting errors – rather than messaging issues. Well-maintained, opt-in lists regularly hit 98-99%. If your delivery rate is lagging, no amount of copy optimization will help. Fix your list first.
Open rate – the 98% myth and what’s actually measurable
SMS open rates are consistently cited between 90% and 98%, with 81% of recipients reading the message within 5 minutes. Compared to email’s 20-28%, those numbers look extraordinary but there’s an important methodological gap. Email tracks opens via a tracking pixel. SMS has no equivalent mechanism. The 90-98% range is largely inferred from delivery reports and response behavior, not from direct measurement.
💡 What does this mean for you? Treat SMS open rate as a channel-level indicator of visibility, not a campaign-level KPI you can optimize. If the message was delivered, it was almost certainly read. The real question is what happened next, which is where CTR comes in.
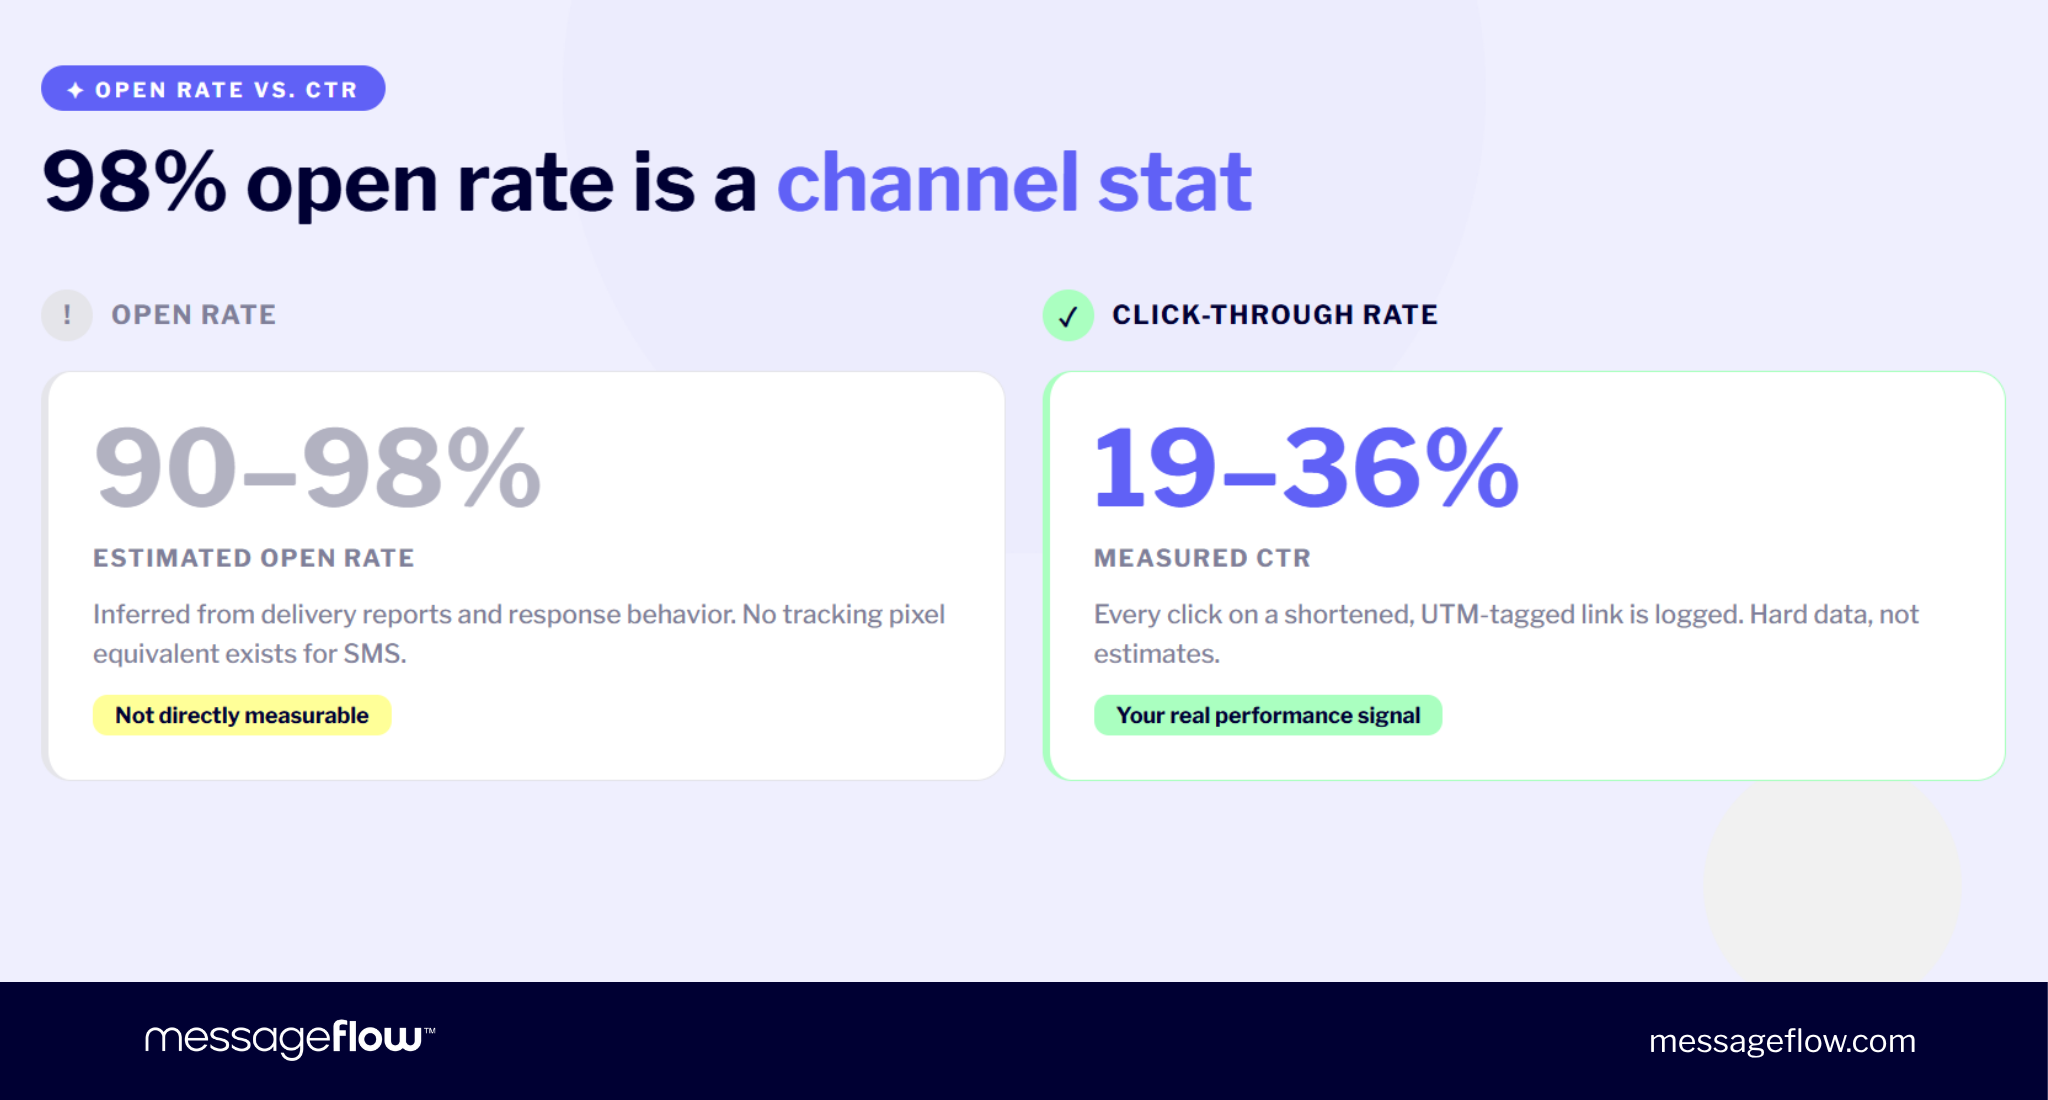
Click-Through Rate – the most reliable engagement signal
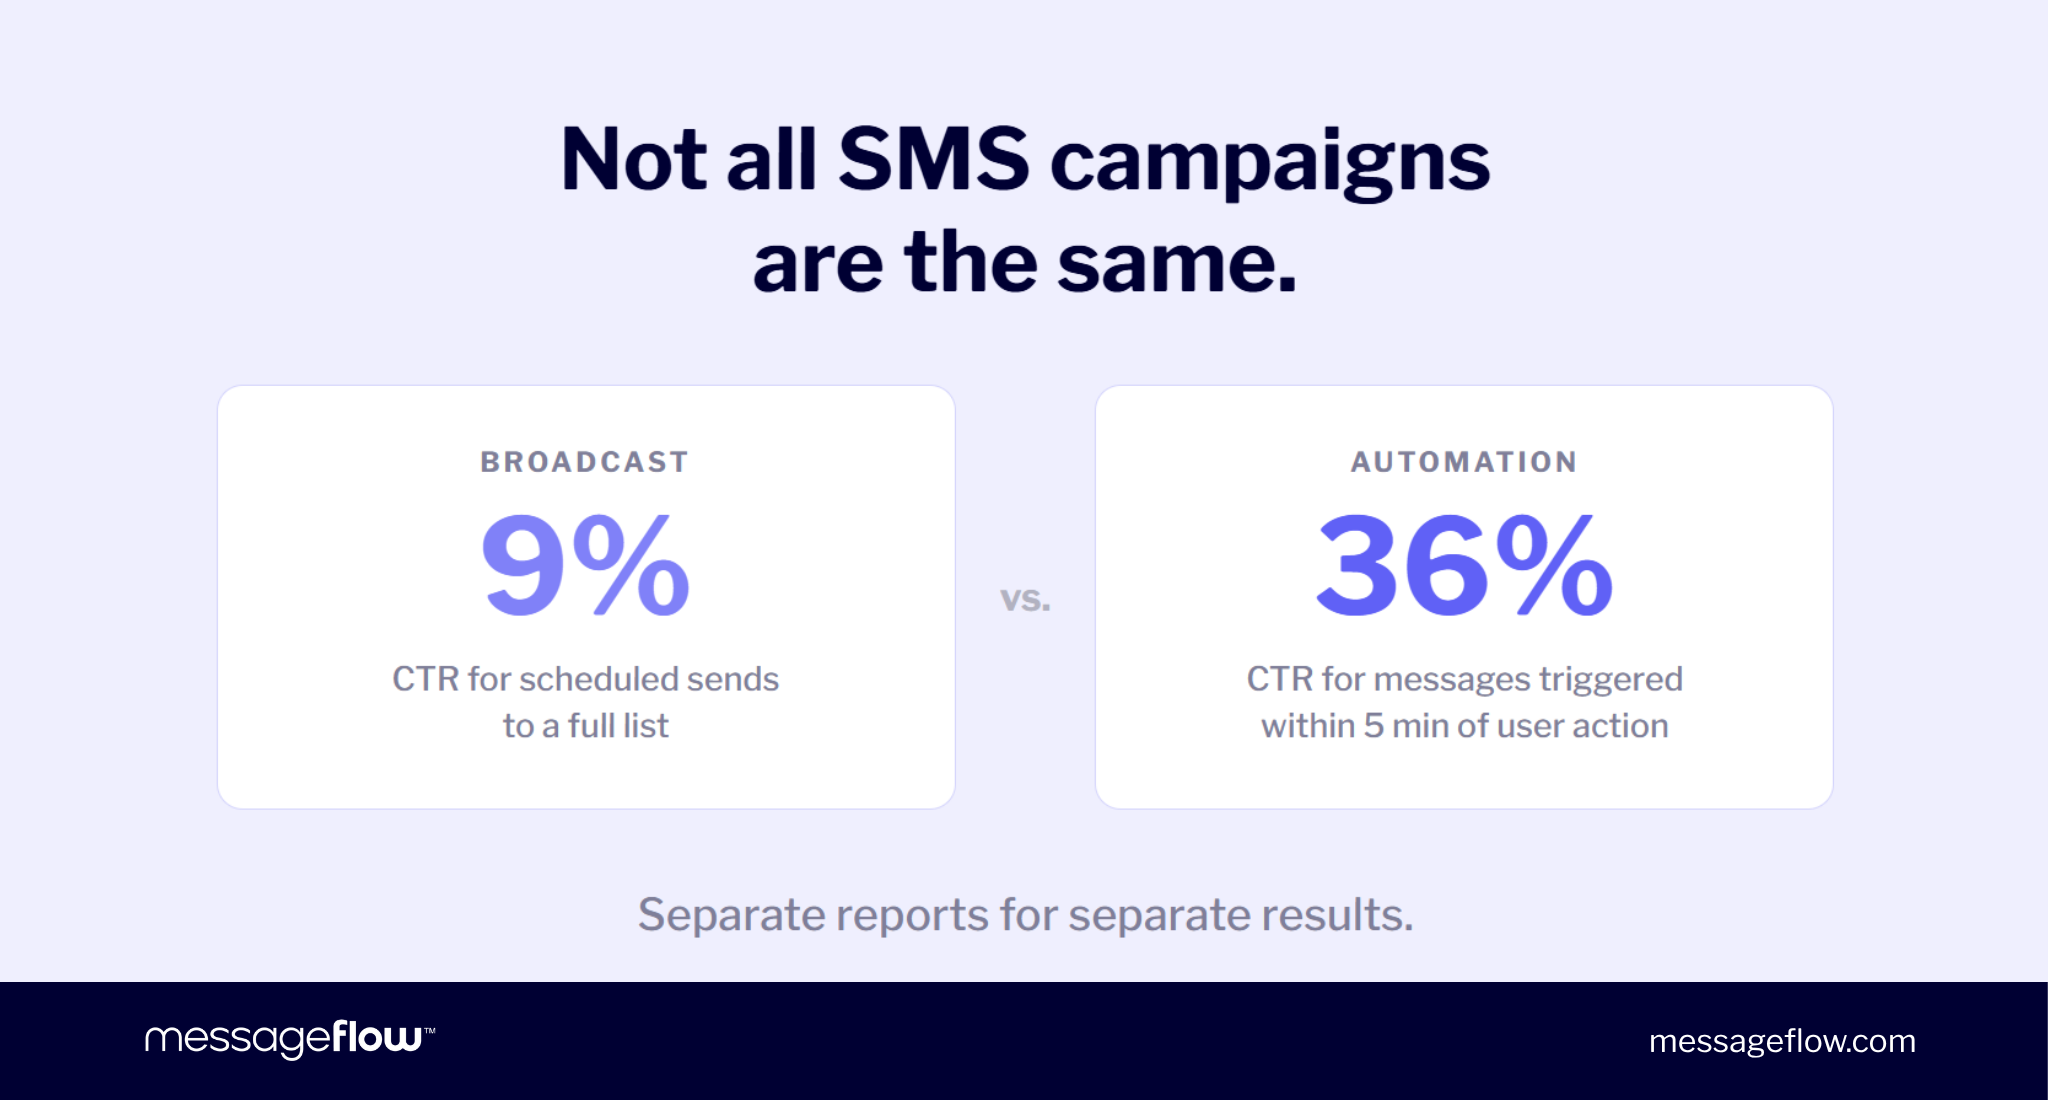
CTR measures the percentage of recipients who clicked a link in your message. It’s the most operationally useful SMS metric because it’s based on hard data. Every click on a shortened, UTM-tagged link gets logged. The aggregate average CTR sits at roughly 19%, but this number obscures a critical distinction that many benchmark reports fail to make.
Broadcast campaigns (a single promo sent to a full list) and automated flows (triggered by a specific user action) produce very different results – something for you to keep in mind at all times.
💡 A flash sale SMS to your entire base and a cart abandonment message sent 5 minutes after someone leaves your site are fundamentally different use cases. Treating them as one category makes the benchmark nearly meaningless. When you evaluate your CTR, compare broadcast to broadcast and automation to automation, never mix them.
Conversion rate – where revenue gets made
Conversion rate tracks the percentage of recipients who complete a desired action like a purchase, a booking or a form submission. According to Omnisend, SMS programs with solid segmentation and clear CTAs convert at 21-30%, compared to 10-15% for email.
Same source shows that cart abandonment flows are particularly strong, generating $3.07-$10.78 in revenue per message in ecommerce. But these numbers come from well-run programs with behavioral targeting. A generic discount blast to an unsegmented list won’t come close.
Unsubscribe rate – the health check brands ignore
SMS unsubscribe rates benchmark at below 3.5% per send, with well-managed programs sitting at 0-1.5%. That’s relatively low but only because SMS requires deliberate opt-in, which filters for intent.
As per Tabular, when unsubscribe rates start climbing above 3.5%, it’s usually a frequency problem: 61% of subscribers who opt out cite too many messages as the reason. This metric is easy to overlook because the absolute numbers are small, but a rising trend is an early warning sign that something in your cadence or targeting is off.
ROI and cost per conversion
Average SMS marketing ROI sits between $21 and $71 for every $1 spent.
“At roughly $0.02–0.04 per message, the barrier to entry for SMS is very low. But in 2026, with increasingly strict consent regulations, the game is no longer about send costs. What determines real ROI is the cost of acquiring informed consent and keeping your contact list in good shape. The rule of thumb worth following: a smaller, well-curated list with a relevant message will generate more revenue than a mass send to everyone.” – says Paulina Gorczyca, Head of Sales at MessageFlow.
SMS marketing benchmarks for 2026 – global data
The previous section defined what each metric measures. This one focuses on the ranges you should actually compare yourself against and the variables that explain why two campaigns in the same industry can produce wildly different results.
Open rate: 90-98% and why context matters
The 90-98% SMS open range from 2023-2025 studies holds steady year over year, which is telling by itself. It suggests that SMS open rate is more a property of the channel than a variable you can meaningfully influence.
Transactional messages (order confirmations, 2FA codes) cluster at the top of the range. Promotional campaigns to broader segments sit closer to 90%. Either way, the number dwarfs email’s 20-28% but as I said earlier, the measurement basis is fundamentally different, and optimizing for open rate in SMS is largely a dead end. Your energy is better spent on what happens after the message is read.
CTR: 19-36% – what separates top and bottom performers
The aggregate SMS CTR average of 19% is a useful floor, not a target. The gap between bottom and top performers comes down to three things: campaign type, timing, and segmentation.
Campaign type is the biggest variable. A study of 400 businesses reported CTRs of 19-36%, with the highest results coming from time-sensitive triggers such as flash sales, cart abandonment, back-in-stock alerts. Mobile Text Alerts claim that messages sent within 5 minutes of a user action can reach 36% CTR versus roughly 9% for scheduled broadcasts to a full list. That’s a major difference based on timing alone.
The peak CTR window for scheduled sends, based on an analysis of over 38 million messages, falls between 5 PM and 8 PM, producing a 28.6% average CTR. Outside that window, results drop noticeably. If you’re sending broadcast campaigns, time of day is one of the simplest levers you can pull.
Conversion rate: 21-30% by campaign type
Conversion benchmarks follow a similar pattern to CTR: the averages are high relative to other channels, but the spread within SMS is significant. Omnisend reports that well-optimized programs convert even at 21-30%, but the type of campaign shifts the number considerably.
Cart abandonment flows sit at the high end. Broad promotional sends to a full list perform closer to the low end or below it if your segmentation is weak.
💡 One data point worth noting: tech and SaaS companies report SMS conversion rates of 31-40%, which is the highest of any vertical. The likely explanation is that SMS in tech tends to be used for high-intent moments like trial expirations, renewal reminders, onboarding nudges, rather than cold promotions.
Response rate and opt-out rate benchmarks
Two metrics that rarely headline benchmark reports but are worth tracking. SMS response rate averages 45% – partly because the format invites replies more naturally than email, and partly because a well-written SMS reads like a message from a person, not a system.
On the opt-out side, the benchmark is below 3.5% per send, with well-run programs at 0-1.5%. Reducing frequency and improving opt-in clarity lowers unsubscribes by 28%. Worth noting: opt-out rates tend to spike after the second or third message to a new subscriber. If you’re seeing high churn early in the lifecycle, the problem is likely expectation-setting at sign-up, not the messages themselves.
SMS benchmarks by industry – where performance varies most
Aggregate benchmarks give you a reference point. Industry-level data tells you whether your results are actually good for the context you’re operating in.
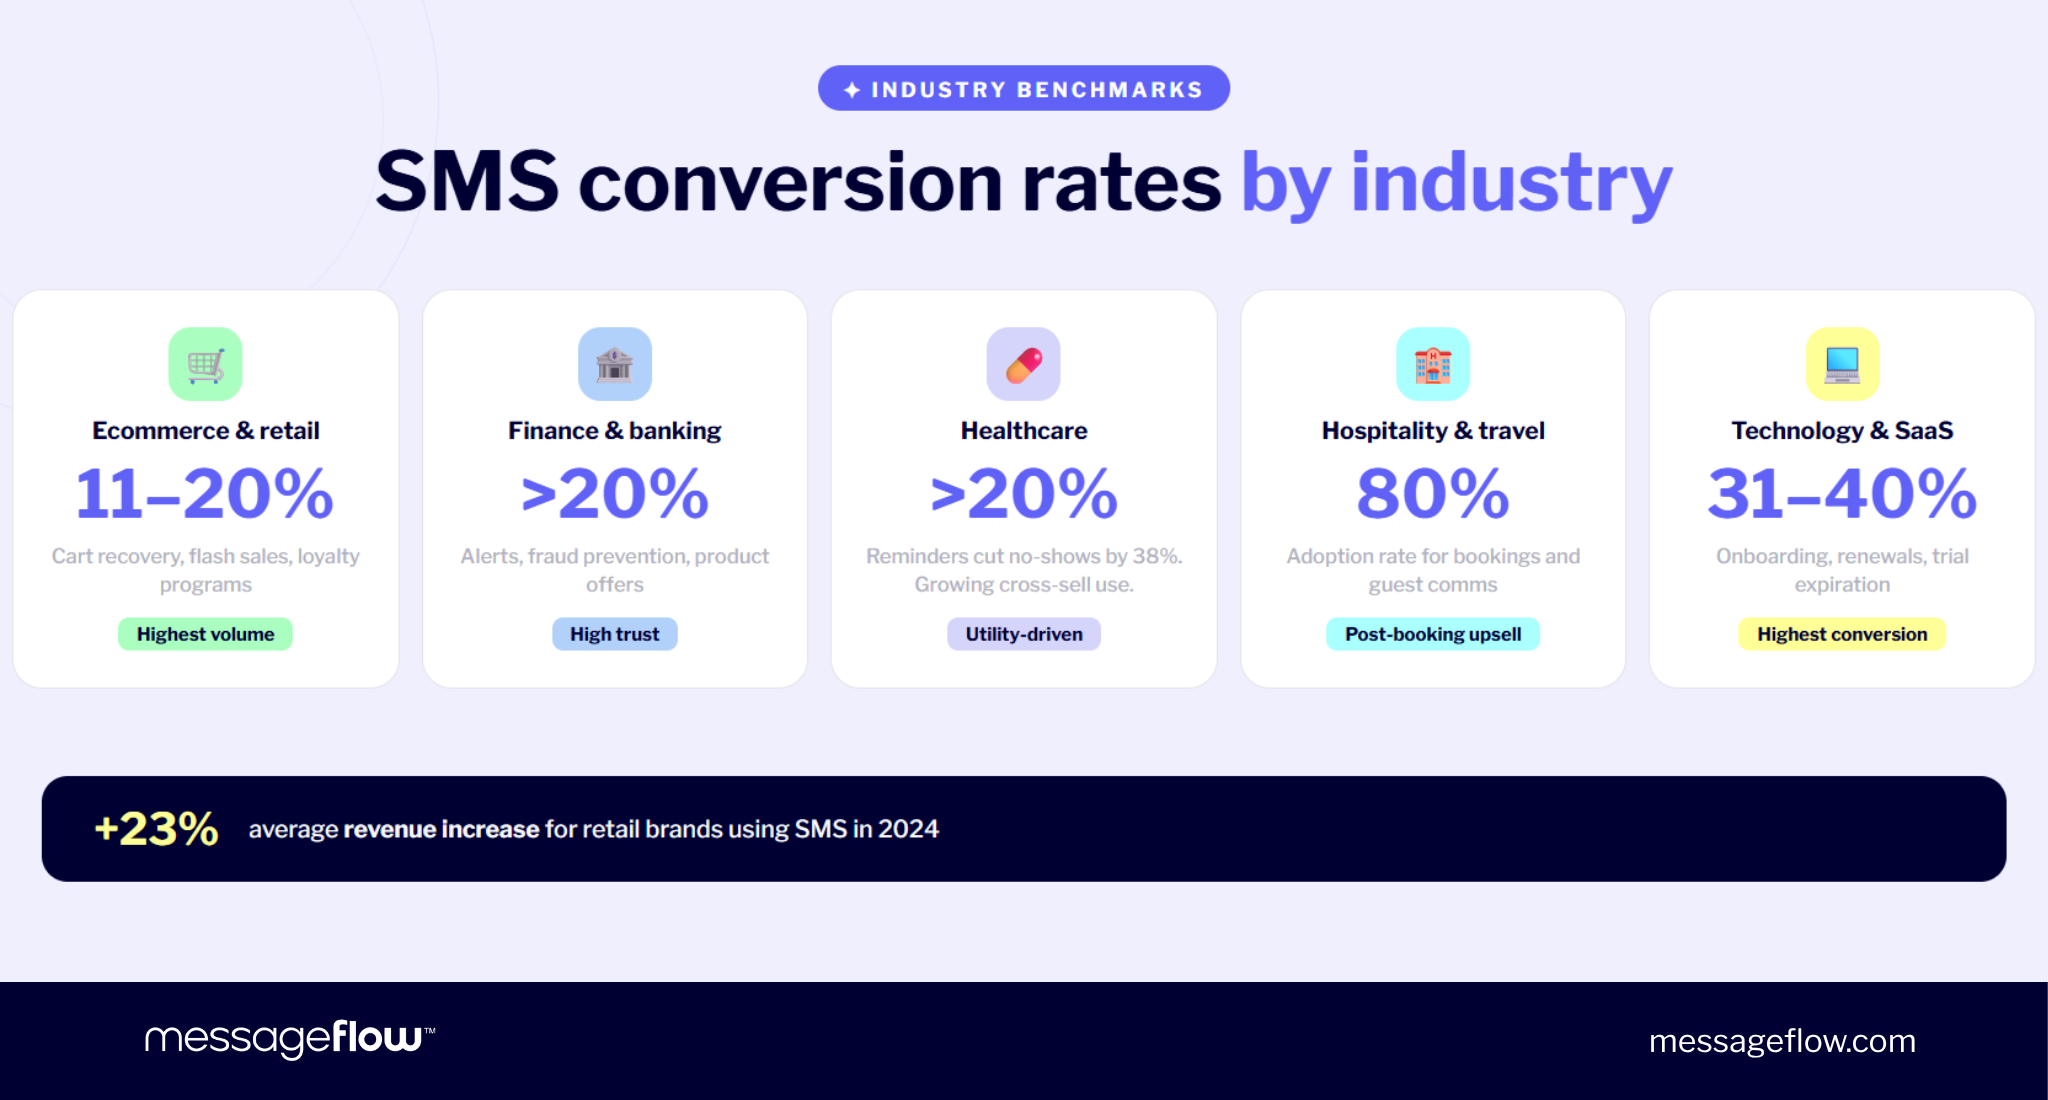
Ecommerce and retail – cart recovery, flash sales, loyalty
Retail is where SMS marketing generates the most data, simply because the volume is highest and the feedback loops are shortest. SMS conversion rates in ecommerce sit at 11-20% – lower than other verticals at first glance, but the math works differently at scale. High send volumes and low per-message costs mean that even modest conversion rates produce strong ROI. Retailers using SMS saw an average 23% revenue increase in 2024.
The campaigns that perform best share a common structure: urgency plus specificity. Cart abandonment flows with a direct link back to the product. Flash sales with a hard deadline. Loyalty rewards with a personal discount code. Generic “check out our new collection” messages fall flat by comparison because they ask the recipient to do the work of figuring out why they should care.
Finance and banking – alerts, fraud, high-value conversions
Financial services consistently report SMS conversion rates above 20%, with 72% of financial institutions using SMS for alerts and fraud notifications. The high conversion numbers need context, though. SMS lists in finance tend to be smaller and more carefully curated, because regulatory requirements enforce a higher consent standard. You’re reaching people who deliberately opted in, which naturally inflates performance metrics.
The typical use case isn’t prospecting, it’s deepening relationships with existing customers. Transaction alerts, security notifications, product offers to pre-qualified segments. SMS in finance works well precisely because the trust threshold is already cleared before the message arrives.
Healthcare – appointment reminders, the no-show problem
In appointment-based industries, SMS solves a problem that email can’t reliably address. Appointment reminders sent via SMS reduce no-shows by roughly 38%, and 83% of healthcare organizations use SMS as part of their patient communication. Conversion rates hold above 20%.
This isn’t traditional marketing in the promotional sense, but the business impact is the same: more appointments kept, fewer empty slots, higher revenue per working day. The growth edge in healthcare and beauty is in cross-sell flows – a follow-up SMS suggesting a complementary treatment the day after a visit, for example. These work because the timing is anchored to a real interaction, not a calendar schedule.
Hospitality and travel – booking confirmations, last-minute deals
Hospitality has an 80% SMS adoption rate for booking confirmations and guest communication, making it one of the most SMS-saturated verticals. The channel fits the industry’s rhythm: booking confirmations need to arrive instantly, check-in instructions need to be accessible without an internet connection, and last-minute deals are inherently time-sensitive.
Where hospitality SMS gets interesting is in the post-booking window. Upsell messages including room upgrades, spa packages, and early check-in sent between booking and arrival convert well because the recipient is already in a spending mindset. The key constraint is frequency Guests who receive more than two or three messages before arrival start to perceive it as noise rather than service.
Technology and SaaS – onboarding, renewal, product updates
Tech companies report the highest SMS conversion rates of any vertical at 31-40%. The reason is structural: SMS in SaaS is almost exclusively triggered by high-intent moments. Trial expirations, renewal windows, onboarding milestones, feature adoption nudges. These are messages sent to users who are already engaged with the product, not cold audiences.
💡 The takeaway for other industries is worth noting. The highest-converting SMS programs aren’t the ones with the best copy. They’re the ones with the best timing and targeting logic. Tech companies happen to have rich behavioral data to work with but the principle applies broadly.
SMS vs. email – side-by-side benchmark comparison
SMS and email aren’t interchangeable, and framing them as competitors misses the point. They operate on different timescales, serve different moments in the customer journey, and cost differently to produce. But a direct comparison is still useful because it clarifies where each channel has a structural advantage and where combining them makes more sense than choosing one.
| Metric | SMS | |
|---|---|---|
| Open rate | 90-98% (estimated) ¹ | 20-28% ¹ |
| CTR | 19-35% ¹ | 2.5-3.5% ¹ |
| Conversion rate | 21-30% ² | 10-15% ² |
| Response rate | 45% ³ | 6% ³ |
| Unsubscribe rate | <3.5% / send ¹ | ~1.35% / send ¹ |
| ROI | $21-$71 per $1 spent ⁴ | $36$-45 per $1 spent ⁴ |
¹Sakari ²Omnisend ³Yournotify ⁴True Dialog
🚩 A few things worth flagging before drawing conclusions from this table.
Unsubscribe rates look higher for SMS than email, which feels counterintuitive. The explanation lies in the measurement basis. Email typically calculates unsubscribes relative to opens, SMS relative to sends. With SMS open rates above 90%, the effective gap narrows considerably. Keep this in mind when comparing reports across channels – the numbers aren’t directly equivalent.
ROI comparisons are similarly misleading at face value. Email has near-zero marginal send costs at scale, but requires significant production effort: content and design, rendering tests, deliverability management, spam filter navigation. SMS costs per message but takes a relatively short time to produce and doesn’t compete with a spam folder for attention. The real cost equation depends on your team’s capacity as much as your send volume.
The more productive framing isn’t SMS or email. It’s knowing when each channel earns its place in the sequence. An email that goes unopened followed by an SMS remarketing message to non-openers is one of the most effective combinations in digital marketing. SMS picks up where email’s visibility problem begins.
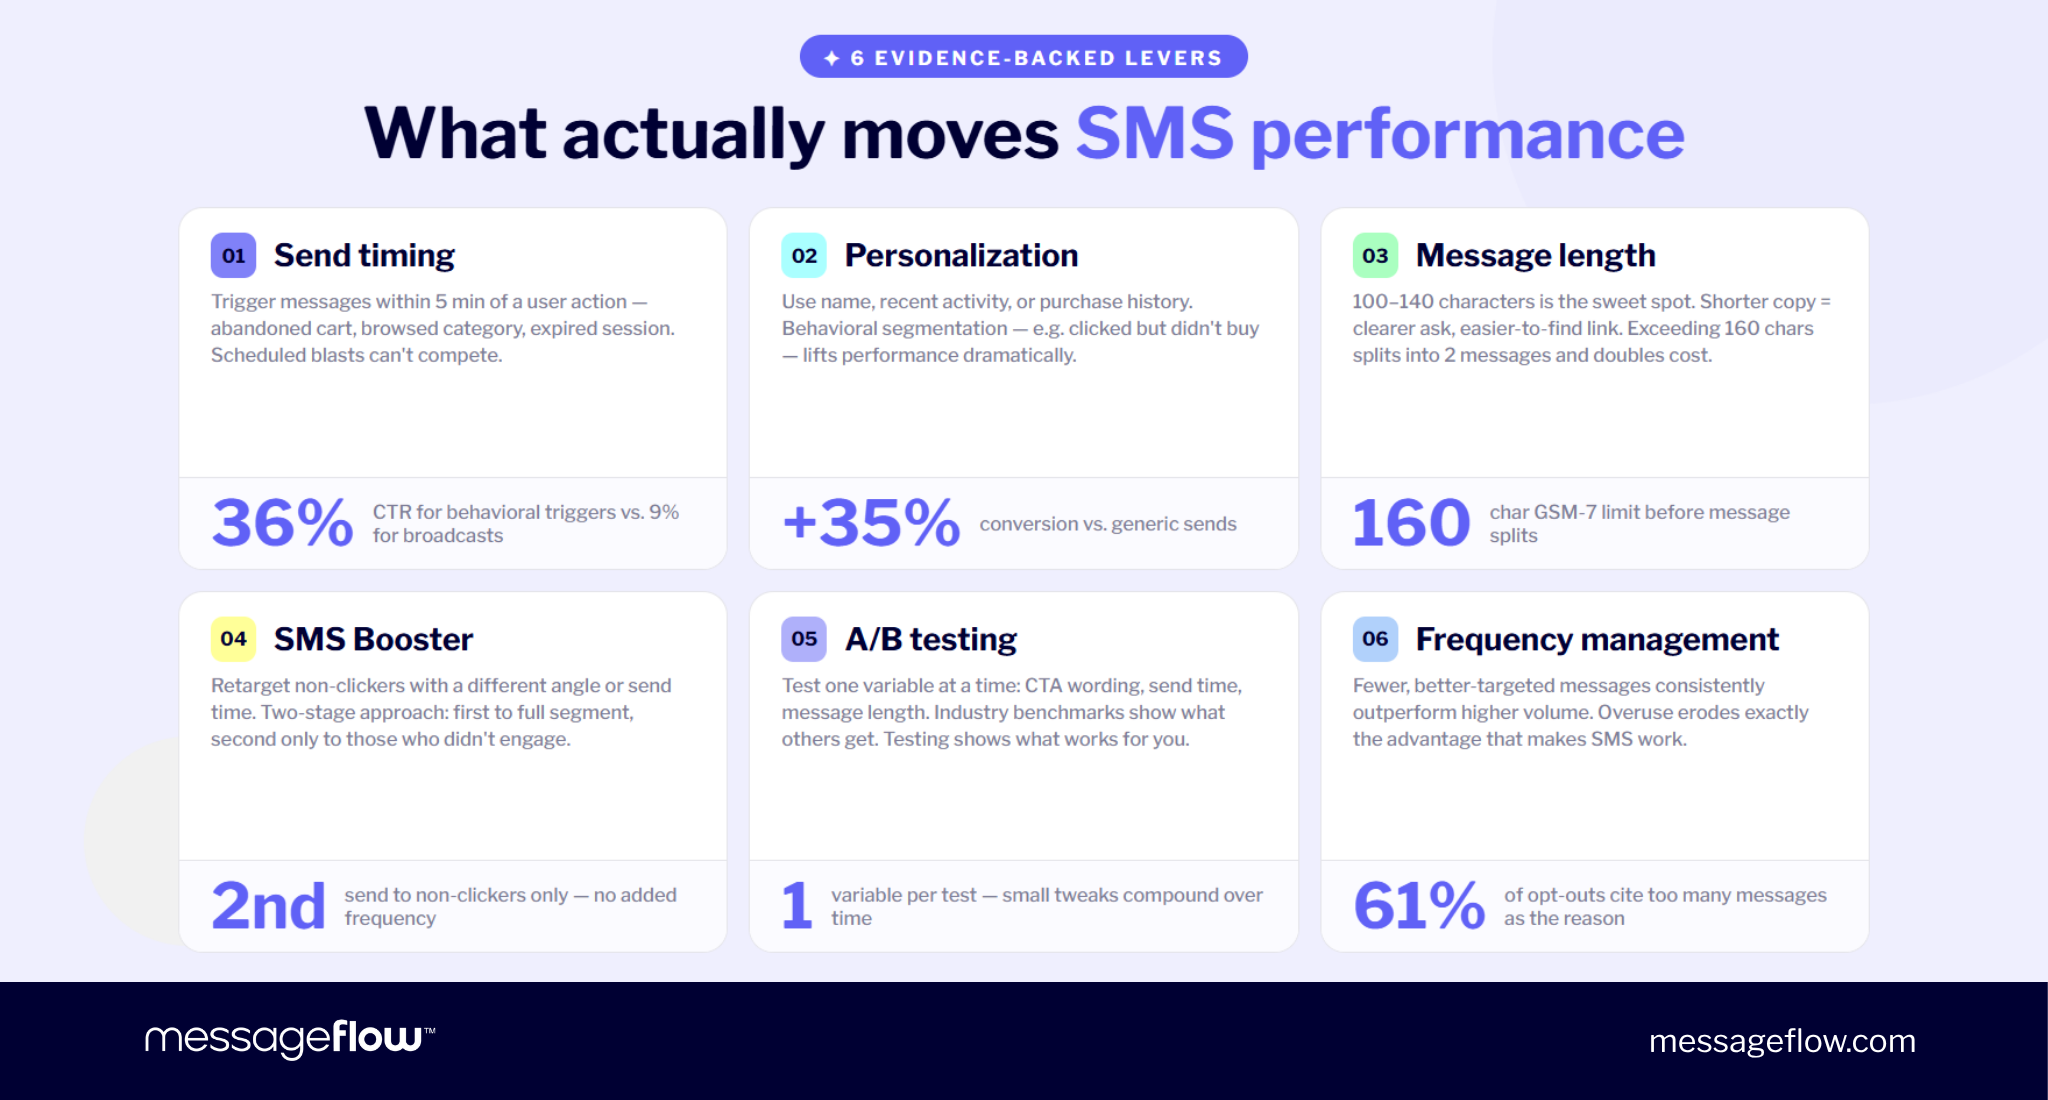
What actually moves the numbers – 6 evidence-backed levers
Knowing where the benchmarks sit is a good starting point. In this section I cover what separates campaigns at the top of those ranges from those at the bottom, based on data, instead of conventional wisdom.
Sending time – the 5-minute rule after user actions
Timing is one of the easiest variables to tweak and one of the hardest to ignore once you’ve seen the data. As per MTA, messages sent within 5 minutes of a user action – an abandoned cart, a browsed category, an expired session – reach CTRs of up to 36%, compared to roughly 9% for scheduled broadcasts. That’s not a marginal improvement but a whole different order of magnitude.
This may be the strongest argument for integrating SMS with marketing automation rather than treating it as a standalone channel. A manually scheduled blast will never match the performance of a behaviorally triggered message because the relevance window for SMS is measured in minutes, not hours.
Personalization and behavioral segmentation
Personalized SMS campaigns using the recipient’s name, recent activity, or purchase history convert 35% better than generic sends. Behavioral segmentation (e.g., isolating users who clicked but didn’t purchase) lifts CTR by 47% compared to email sent to the same segment. Personalization using first name alone improves conversion by 22%.
These aren’t necessarily surprising findings but the gap between what the data shows and what most campaigns actually look like is still wide. A recipient who buys weekly and one who hasn’t engaged in three months often receive the same message. That’s where the opportunity sits, often unrealized.
Message length – the 100-140 character sweet spot
SMS has a hard constraint that most channels don’t: 160 characters in GSM-7 encoding, after which the message splits into two parts and doubles the cost. Shorter messages (100-140 characters) tend to produce higher CTR – less text means the link is easier to find and the ask is clearer. Messages that stay within this range also avoid the common SMS mistakes that hurt CTR.
Format matters too. MMS campaigns generate up to 20% higher engagement than plain texts, but the tradeoff is higher cost and potentially inconsistent rendering across devices. MMS works best for product-driven campaigns where a visual makes the offer tangible – a new collection, a food delivery promo, a property listing.
SMS booster – retargeting non-clickers
What happens to recipients who received your message but didn’t click? One approach is a follow-up send with a different CTA or a different time window – a mechanism sometimes referred to as SMS booster. Instead of treating a single send as your entire campaign, you split it into two stages. The first reaches the full segment, the second targets only those who didn’t engage.
This lets you extract additional CTR from the same list without increasing perceived frequency for active recipients. The key is variation. The same message resent an hour later feels like spam. A different angle sent the next morning feels like a second chance.
A/B testing – the only way to find your true benchmark
Industry benchmarks tell you what others achieve, in their specific circumstances. A/B testing tells you what works for your audience. Two versions of copy, two send times, two CTAs compared on the same list. Without systematic testing, you’re optimizing against someone else’s data, which is better than guessing but worse than building your own performance baseline.
The most productive tests don’t involve dramatic overhauls. Small, isolated variables like:
- a question vs. a statement as the opening line
- a percentage discount vs. a fixed amount
- morning vs. evening delivery
compound over time into a clear picture of what your specific subscribers respond to.
Frequency management – why more sends hurt CTR
61% of subscribers who opt out cite excessive message frequency as the reason. Reducing cadence and improving opt-in clarity lowers unsubscribes by 28%. The math is straightforward: every unnecessary message you send degrades list quality by pushing out the most engaged recipients first – the ones who care enough to actively unsubscribe rather than simply ignoring you.
There’s no universal right frequency for SMS but the pattern in the data is consistent: programs that send fewer, better-targeted messages outperform those that send more broadly. SMS earns its high engagement rates partly because recipients aren’t drowning in it. Overuse erodes exactly the advantage that makes the channel work.
Global SMS market context – scale, growth, and what’s coming
The performance numbers in this guide reflect a channel that’s growing in volume, investment, and sophistication, not one coasting on legacy infrastructure. Here’s the market context behind those numbers.
A2P SMS market size and trajectory
Grand View Research reports that A2P (Application-to-Person) messaging, the infrastructure behind every automated SMS you receive from a business, is a $71.5 billion market as of 2024, projected to reach $96.7 billion by 2030 at a 5.4% CAGR. FMI claims the enterprise segment alone is expected to grow from $7.9 billion in 2025 to $12 billion by 2035.
These aren’t numbers driven by consumer texting which has been flat or declining for years. The growth comes from businesses using SMS for authentication, transactional alerts, and marketing at increasing scale.
💡 Industry data shows companies now allocate an average of 18.76% of their total marketing budget to SMS, and adoption of SMS marketing software rose from 55% in 2022 to 80% in 2024.
Europe: GDPR-driven opt-in quality advantage
The global A2P market splits roughly into three regions: North America at 32%, Europe at 27%, and Asia-Pacific at 31%. Europe’s share is smaller than the other two, but comes with a structural quality advantage: GDPR compliance has driven a 15% increase in SMS opt-in list quality across the region.
That’s a crucial nuance for benchmarks. Higher opt-in standards mean smaller lists, but with recipients who consciously chose to be there. The result is higher engagement rates per message, which partly explains why European SMS campaigns often outperform North American ones on CTR and conversion, despite lower overall volume. During Cyber Week 2024, business SMS volume in Europe grew by 47% YoY, compared to just 11% in North America. That’s a sign that European marketers are leaning into SMS more aggressively at key commercial moments.
💡 68% of European businesses use SMS for customer support and transactional communication. The growth frontier is on the marketing side, where adoption is still catching up to the transactional base.
RCS as the next benchmark category
Any conversation about SMS benchmarks in 2026 needs to acknowledge what’s arriving alongside traditional texting. Rich Communication Services campaigns are achieving engagement rates up to 50%, with 2.1 billion active users projected by 2026. Apple’s decision to support RCS in 2024 triggered a 500% surge in global RCS traffic, removing the biggest adoption barrier that had held the format back.
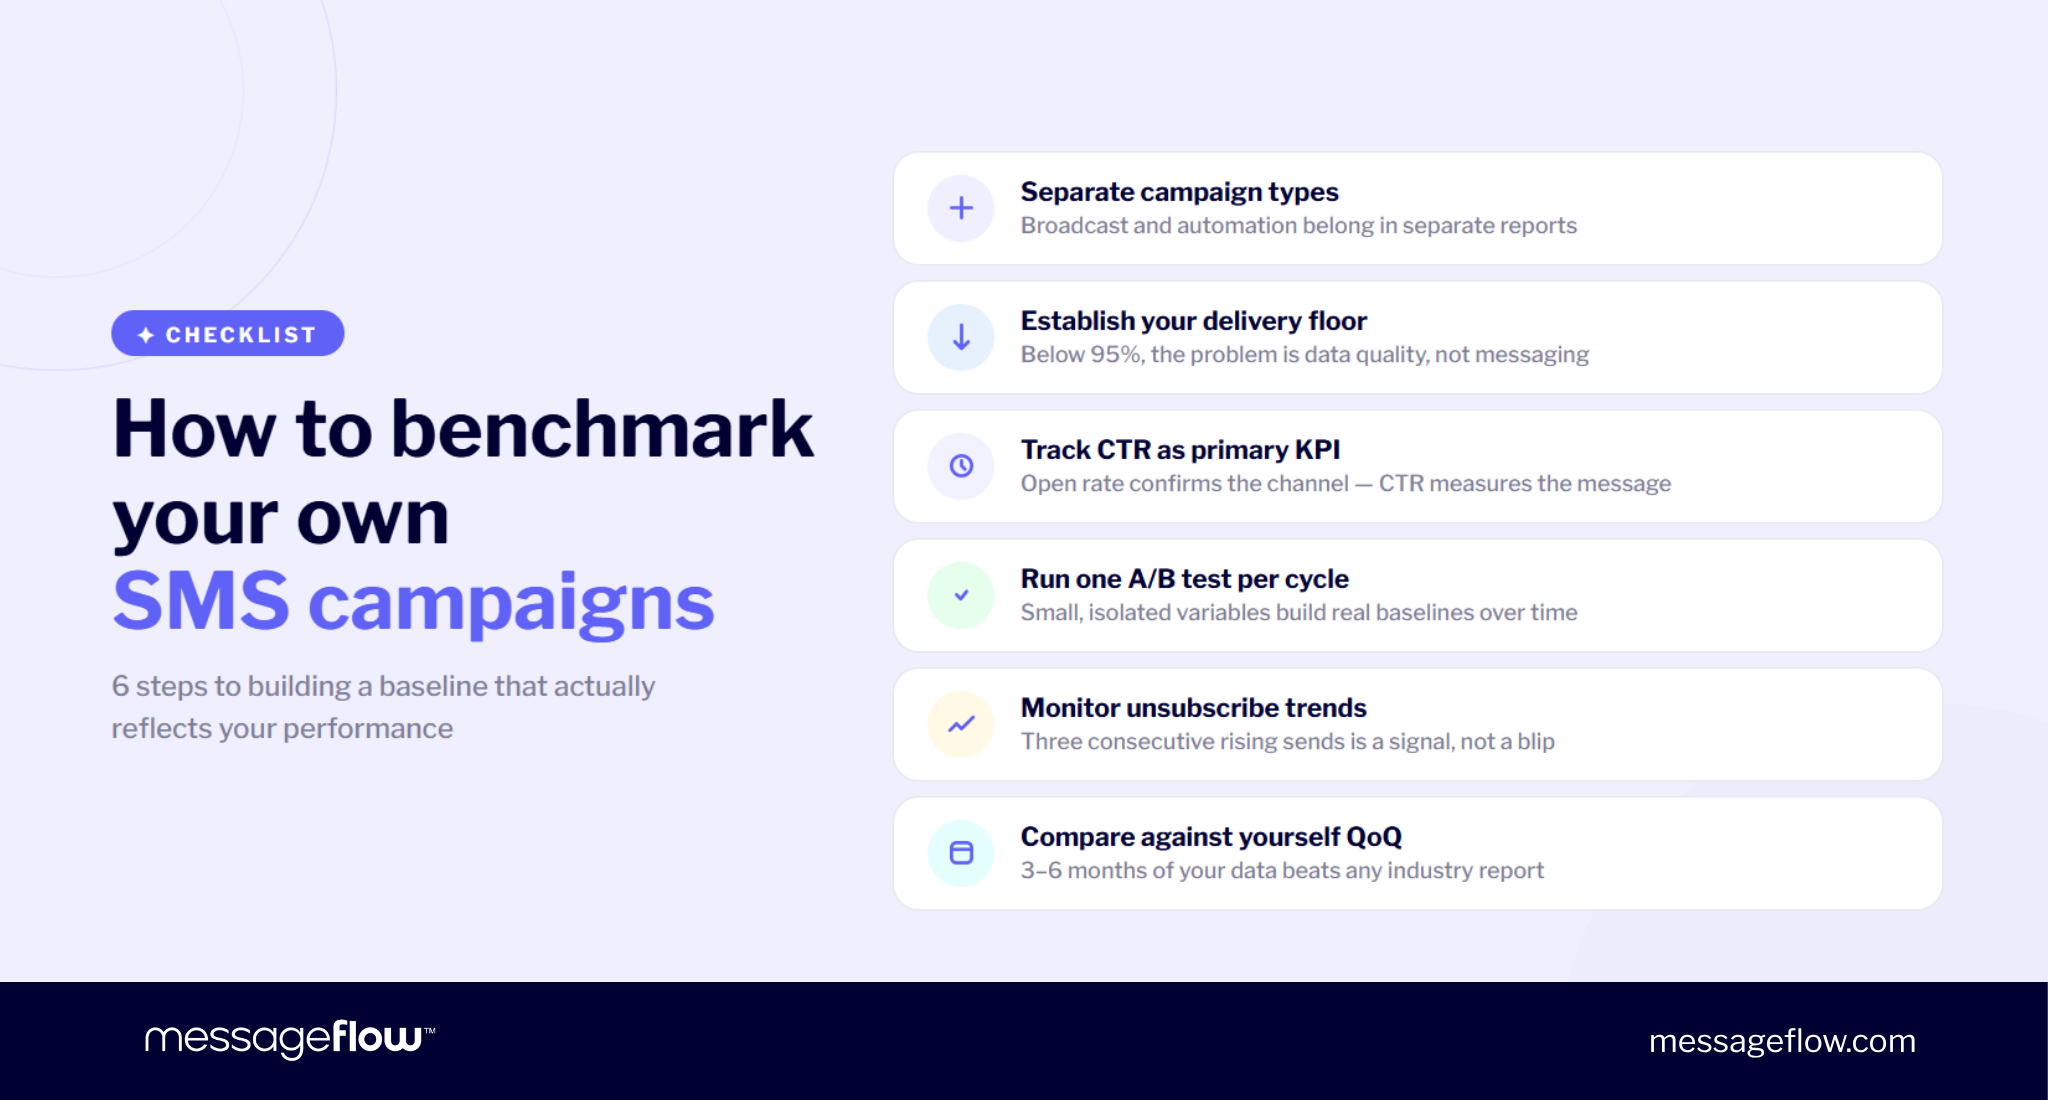
How to benchmark your own SMS campaigns
Industry averages are a reference point, not a target for you to aim for. Your benchmark is your own data tracked consistently, compared against the right baseline, and improved over time. Here’s how to build that baseline.
Separate campaign types before comparing anything. Broadcast promotions and automated flows produce fundamentally different results. Mixing them into a single CTR or conversion number gives you an average that describes neither. Track each type independently, and compare your broadcast CTR against broadcast benchmarks (closer to 9-19%) and your automation CTR against automation benchmarks (2036%).
Establish your delivery rate floor first. If delivery is below 95%, everything downstream – open rate, CTR, conversion – is compromised by bad data, not bad messaging. Clean your list, remove invalid numbers, verify opt-in status. Nothing else matters until this metric is stable.
Track CTR as your primary performance indicator. Open rate tells you the channel works. CTR tells you whether your specific message worked. Log it per campaign, per segment, per send time. Over 8-12 weeks of consistent tracking, patterns emerge that no external benchmark can give you.
Run one A/B test per campaign cycle. Not every send needs to be a test, but regular testing is the only way to separate real insights from assumptions. Isolate one variable at a time: CTA wording, send time, message length, personalization depth. Small, consistent tests compound faster than occasional overhauls.
Monitor unsubscribe trends, not snapshots. A single send with 2% opt-outs is normal. Three consecutive sends with rising opt-outs is a signal. Track the trendline per segment – it often reveals frequency or relevance problems before they show up in your aggregate numbers.
Compare against yourself quarter over quarter. Once you have 3-6 months of data segmented by campaign type, audience, and timing, you have something more valuable than any industry report can offer: a performance baseline that reflects your list, your audience, and your product. That’s the benchmark you can start optimizing against.
Conclusion
SMS marketing benchmarks are useful as orientation but only if you read them within the right context. A 19% CTR means something different for a promo blast than for a triggered cart reminder. A 98% open rate sounds transformative until you understand how it’s measured. And industry averages shift depending on list quality, regulation, and how much of the program is automated versus manual.
The highest-performing SMS programs share a few traits that show up consistently across the data: tight segmentation, behavioral triggers over calendar-based sends, short and specific messages, and disciplined frequency management. None of these are secrets. The gap between knowing them and implementing them is where the real performance difference lives.
➡️Ready to measure your SMS performance against these benchmarks? Start with MessageFlow – track delivery, CTR, and conversions in real time. Contact us to learn more.
FAQ – SMS benchmark questions answered
A good SMS CTR falls between 19% and 35%, depending on industry, list quality, and campaign type. Time-sensitive campaigns like flash sales, cart abandonment, back-in-stock alerts, tend to land at the higher end.
The aggregate average across all campaign types sits around 19-20%, but behavioral triggers and strong segmentation push results significantly higher.
SMS open rates are consistently cited between 90% and 98%. The higher end reflects transactional messages and well-maintained lists.
A realistic average for promotional campaigns is 90-95%. Regardless of where in the range you fall, SMS dramatically outperforms email’s typical 20-28% open rate. Most messages are read within 3 minutes of delivery.
The 98% figure is widely repeated but needs context. Standard SMS has no tracking pixel equivalent. The number is estimated from delivery reports and response behavior, not measured directly.
Industry consensus places the realistic range at 90-98%. Even at the lower end, SMS remains the highest-visibility marketing channel available. The more actionable metric is CTR, which is measured precisely.
Industry research places average SMS marketing ROI between $21 and $71 for every $1 spent, making it one of the highest-return channels in digital marketing.
Cart abandonment flows and flash sales tend to hit the upper range. For comparison, email marketing typically returns $36-$45 per $1 spent – strong in its own right, but with a different cost structure and production overhead.
A delivery rate of 95% or above is considered strong. Rates below that threshold usually indicate list quality issues – invalid numbers, inactive subscribers, or poor list hygiene.
Top-performing programs with well-maintained, opt-in lists regularly reach 98-99%. Delivery rate is the first metric to check before analyzing anything else.
Industry benchmarks place SMS unsubscribe rates below 3.5% per send, with well-managed programs at 0-1.5%. Rates above 3.5% typically signal frequency problems, poor segmentation, or mismatched subscriber expectations.
Unlike many email lists, SMS subscribers opt in deliberately which keeps baseline churn low, but also means that when people do unsubscribe, the signal is worth paying attention to.