When looking at the broader business communication context, where every character and image holds immense significance, Push Notifications ePush notification A/B testing, or split testing, means sending two versions of the same notification to different segments of your audience, measuring which performs better, and rolling out the winner. One variable changes between versions. Everything else stays the same.
That constraint matters. If your variants differ in copy, timing, and emoji simultaneously, you can’t tell what drove the result. One change at a time.
This guide covers what to test, how to structure a push A/B test, how to read the results, and how to avoid the mistakes that make tests misleading.
Why A/B test push notifications?
Testing the send time alone can increase reaction rates by 40% (Business of Apps, 2025). Combined with advanced segmentation, A/B testing can push reaction rates up by 300%. That’s not from a complete overhaul of your push strategy. That’s from systematically testing one thing at a time and carrying the winning insight into the next campaign.
Without testing, you’re making the same assumptions every send and hoping the results eventually improve. They usually don’t.
Push A/B test campaign structure: variables and fields
Most push platforms represent a split test as a parent campaign with two or more variant objects. The core fields you’ll work with:
| Field | Description |
|---|---|
| campaign_id | Unique identifier for the parent test |
| variant_id | Identifier for each variant (A, B, C…) |
| audience_split | Percentage of total audience per variant (e.g. 50/50) |
| control_group | Optional: percentage excluded from all variants (baseline) |
| variable | What differs between variants (copy, image, timing, CTA) |
| success_metric | Primary KPI: CTR, open rate, conversion rate |
| duration | How long the test runs before results are read |
| winner_selection | Manual or automatic rollout of winning variant |
When running tests via API rather than dashboard, these fields map directly to your campaign payload. The variable field is the one to get right: if more than one thing differs between A and B, the results are unreadable.
What to A/B test in push notifications
Not every variable moves CTR equally. Start with the ones that typically have the highest impact:
| Variable | What to test | Typical impact |
|---|---|---|
| Message copy | Title phrasing, sentence structure, length | High |
| CTA text | “Shop now” vs “See the offer” vs “Claim deal” | High |
| Emoji | With vs without; different emoji sets | Medium-high |
| Send time | Morning vs evening; weekday vs weekend | High |
| Imagery (rich push) | Product shot vs lifestyle vs text-only | Medium-high |
| Tone | Formal vs conversational vs urgent | Medium |
| Personalization | With user name vs without | Medium |
| Segmentation | Same message to different audience groups | High |
Message copy
Title is where most of the work happens. Test phrasing, length, and sentence structure. Short and direct tends to win: notifications with 10 words or fewer consistently achieve the best CTRs (Business of Apps, 2025). “Tends to” isn’t “always”. That’s why you test.
CTA and action buttons
“Shop now” and “Claim your discount” can produce meaningfully different CTRs even when the underlying offer is identical. If you use action buttons on rich push notifications, test button labels separately from the notification body copy.

Emoji
A HubSpot study found notifications with emoji saw 85% higher open rates. Business of Apps puts the reaction rate increase at 20%. The numbers vary by source, but the direction is consistent. Test with vs without first, then specific combinations once you know your audience responds to them.

Send timing
Tuesday consistently shows the highest global push reaction rate at 8.4%; Sunday comes second at 8.1% (Business of Apps, 2025). Those are averages across millions of sends from every kind of app. They’re a starting point, not a schedule. Test your specific audience before locking in a send window.
Rich media
Rich push notifications with images achieve a CTR of 9.2% versus 6.9% for plain text. If you haven’t tested rich vs standard yet, that’s the first test worth running. After that, test image types: product shots vs lifestyle vs promo banners.
Forming a hypothesis
A test without a hypothesis is just sending two notifications and picking the one that did better. That’s not testing. It’s luck with extra steps.
A useful hypothesis is specific enough to be wrong:
Too vague: “Adding emoji will improve performance.”
Useful: “Adding a fire emoji 🔥 to the title of our flash sale notifications will increase CTR by at least 10% compared to the same title without emoji, measured in our 25–34 age segment.”
The second version tells you exactly what you’re measuring, what counts as a win, and which audience it applies to. It also tells you when the test failed. That’s the part people skip.
Sample size and statistical significance
The most common reason push A/B results don’t hold up is sample size. A test on a few hundred users will produce apparent winners that disappear when you scale to your full audience.
Rough guideline: each variant should reach at least a few thousand recipients before you draw conclusions. The exact number depends on your baseline CTR and the size of the difference you expect to detect. Running a test across 10–20% of your list before selecting a winner is generally more reliable than a 50/50 split on a small audience.
Don’t stop a test early because one variant is leading. Early leads flip constantly as sample size grows.
How to test push notifications without spamming real users
Test segments: Route variants to defined sub-segments rather than your full list. Use behavioral or demographic filters to create groups large enough for statistical significance but small enough to limit exposure.
Sandbox tokens: FCM and APNs both support test device tokens. Register specific devices as test targets and send payloads directly to those tokens without touching your production audience.
Internal testing: Send variants to your team or QA devices before going live. This catches rendering issues, broken deep links, and display problems. It won’t give you engagement data.
Holdout groups: Reserve a percentage of your audience that receives no notification. This measures the lift from the campaign itself, not just between variants.
MessageFlow supports audience segmentation and holdout groups from the campaign builder. See our push notification platform for setup details.
Metrics to track
| Metric | What it tells you |
|---|---|
| Click-through rate (CTR) | Percentage of recipients who tapped the notification |
| Open rate | Percentage who opened the app via the notification |
| Conversion rate | Percentage who completed the desired action |
| View rate | Percentage who saw the notification on the lock screen |
| Opt-out rate | Percentage who disabled notifications after receiving the test |
| Time-to-interact | How quickly users engage after delivery |
| Bounce rate | Percentage of notifications that failed to deliver |
| Retention rate | Long-term impact on user retention |
Which metric to prioritize depends on what the campaign is actually for. Re-engagement campaigns: CTR and time-to-interact. Conversion campaigns: track conversion rate directly, not CTR as a proxy. Frequency experiments: opt-out rate is the number that matters.
Push A/B testing best practices
1. One variable per test If variant B differs from A in copy, emoji, and timing at once, you can’t attribute the result to anything specific. One change at a time.
2. Run tests to completion Set a minimum duration before you start. Stop early only if a variant is actively causing harm (a spike in opt-outs, for example). Otherwise, commit to the window.
3. Avoid testing during unusual periods A test run during Black Friday or a major sale reflects abnormal behavior. Those results won’t apply to a standard Tuesday send. Test under normal conditions.
4. Prioritize by business impact A 2% CTR lift on a low-volume segment is worth less than a 15% lift on your highest-value cohort. Connect results to actual revenue or retention before rolling out changes.
5. Document everything Keep a record of what you tested, the hypothesis, the result, and what you changed. Without that log, you’ll find yourself running the same tests again in six months without knowing it.
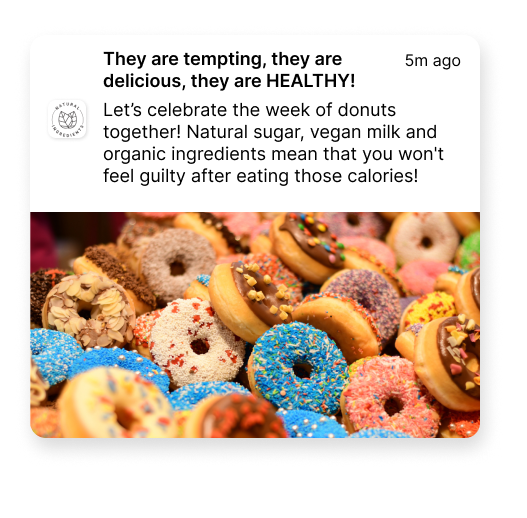
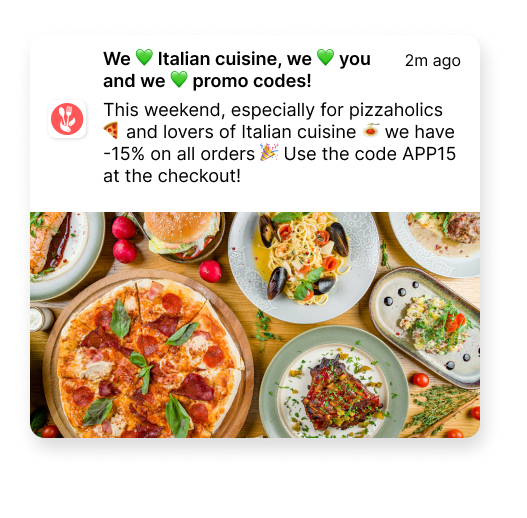
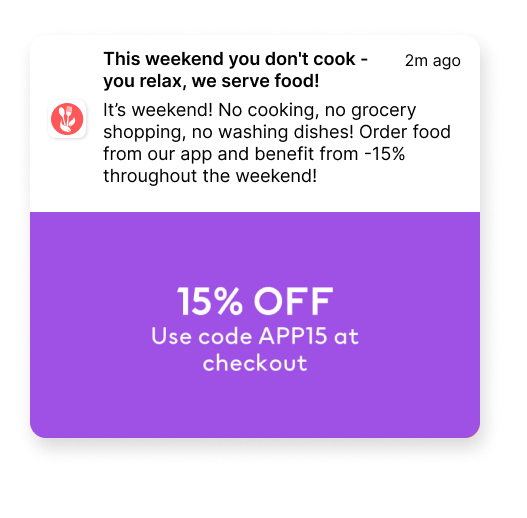
Here’s a comparison of how two Pushes with the same discount can look like:
What to do after the test
Roll out the winner to the remaining audience. Most platforms, including MessageFlow, support automatic winner rollout once a statistical threshold is met.
Then build the next test. Every improvement to your baseline becomes the new control. Teams that treat testing as a continuous workflow instead of an occasional project are the ones whose push metrics compound over time rather than plateau.
For more on building a push strategy that connects to business results, see our guide to mobile push notification marketing and our push notification ideas for copy inspiration.
Running push A/B tests with MessageFlow
MessageFlow’s Mobile Push platform supports split testing for Android (FCM) and iOS (APNs), with audience segmentation, holdout groups, and per-variant analytics in one view. Test on a sub-segment first, then roll out the winner automatically.
CTR, open rate, and conversion rate show up side by side per variant in the analytics panel. Picking a winner is reading the numbers, not exporting a spreadsheet.
As you send out Pushes, MessageFlow equips you with the analytics needed to gather insights and validate your hypotheses. It’s the essential toolkit for decoding the interaction between your messages and user responses, bringing clarity to your path of success. Get in touch at and start testing to get better results.
FAQ: Push notification A/B testing
Push notification A/B testing means sending two or more variants of a notification to separate audience segments, measuring each variant’s performance, and using the winning version for the rest of the campaign. Only one variable should differ between variants.
Start with message copy and send timing. These two variables typically produce the highest measurable impact. Once you have baselines there, move to CTA phrasing, emoji, and rich media formats.
Each variant should reach at least a few thousand recipients. Below that, results are likely to be statistically insignificant. The exact threshold depends on your baseline CTR and the effect size you want to detect.
Route the test to a sub-segment rather than the full list. Use FCM or APNs test device tokens for technical validation. Some platforms, including MessageFlow, also support holdout groups that receive no notification. These are useful for measuring a campaign’s overall lift against a baseline.
At minimum: campaign_id, variant_id, audience_split, variable (what differs between variants), and success_metric. Most platforms also support duration, winner_selection (manual or automatic), and an optional control_group.
Long enough to collect a statistically significant sample, but not so long that seasonality skews the results. For most apps with regular daily active users, 3–7 days is a reasonable window. Don’t stop a test early because one variant is winning.