If you send emails regularly, you already know this uncomfortable truth: launching a campaign is easy. Proving performance isn’t.
I’ve seen teams celebrate a “successful” campaign because it went out on time and reached hundreds of thousands of subscribers. But when the CFO asks what it actually generated – pipeline, revenue, profit – the room goes quiet. That’s the gap this article is meant to close.
Measuring email ROI doesn’t mean tracking vanity numbers. It’s about understanding whether email is driving business outcomes and whether it deserves more budget, more automation, and a more strategic role in your communication mix.
In this guide, I’ll break down:
The difference between metrics and KPIs in email marketing.
The core email marketing KPIs that matter.
A simple way to calculate and interpret email ROI.
What to do when performance drops.
How to connect campaign data to business decisions.
No deliverability deep dives. No tool comparisons. Just what you need to measure your email marketing effectiveness in a way that stands up to scrutiny. That said, let’s start with something many teams get wrong from the get-go: confusing metrics with KPIs.
Metrics vs. KPIs in email marketing: Why the difference matters
One of the biggest reasons teams struggle to prove email marketing effectiveness is simple: they track everything, but prioritize nothing.
Open rate. Click rate. Unsubscribes. Bounces. Heatmaps. Scroll depth. Device splits. You can build a dashboard with 30 numbers in under an hour. But not all numbers deserve executive attention. Here’s the distinction I use:
Metrics are measurements.
Key Performance Indicators are the few measurements tied directly to business outcomes.
💡 Every KPI is a metric, not every metric is a KPI. That difference changes how you run campaigns.
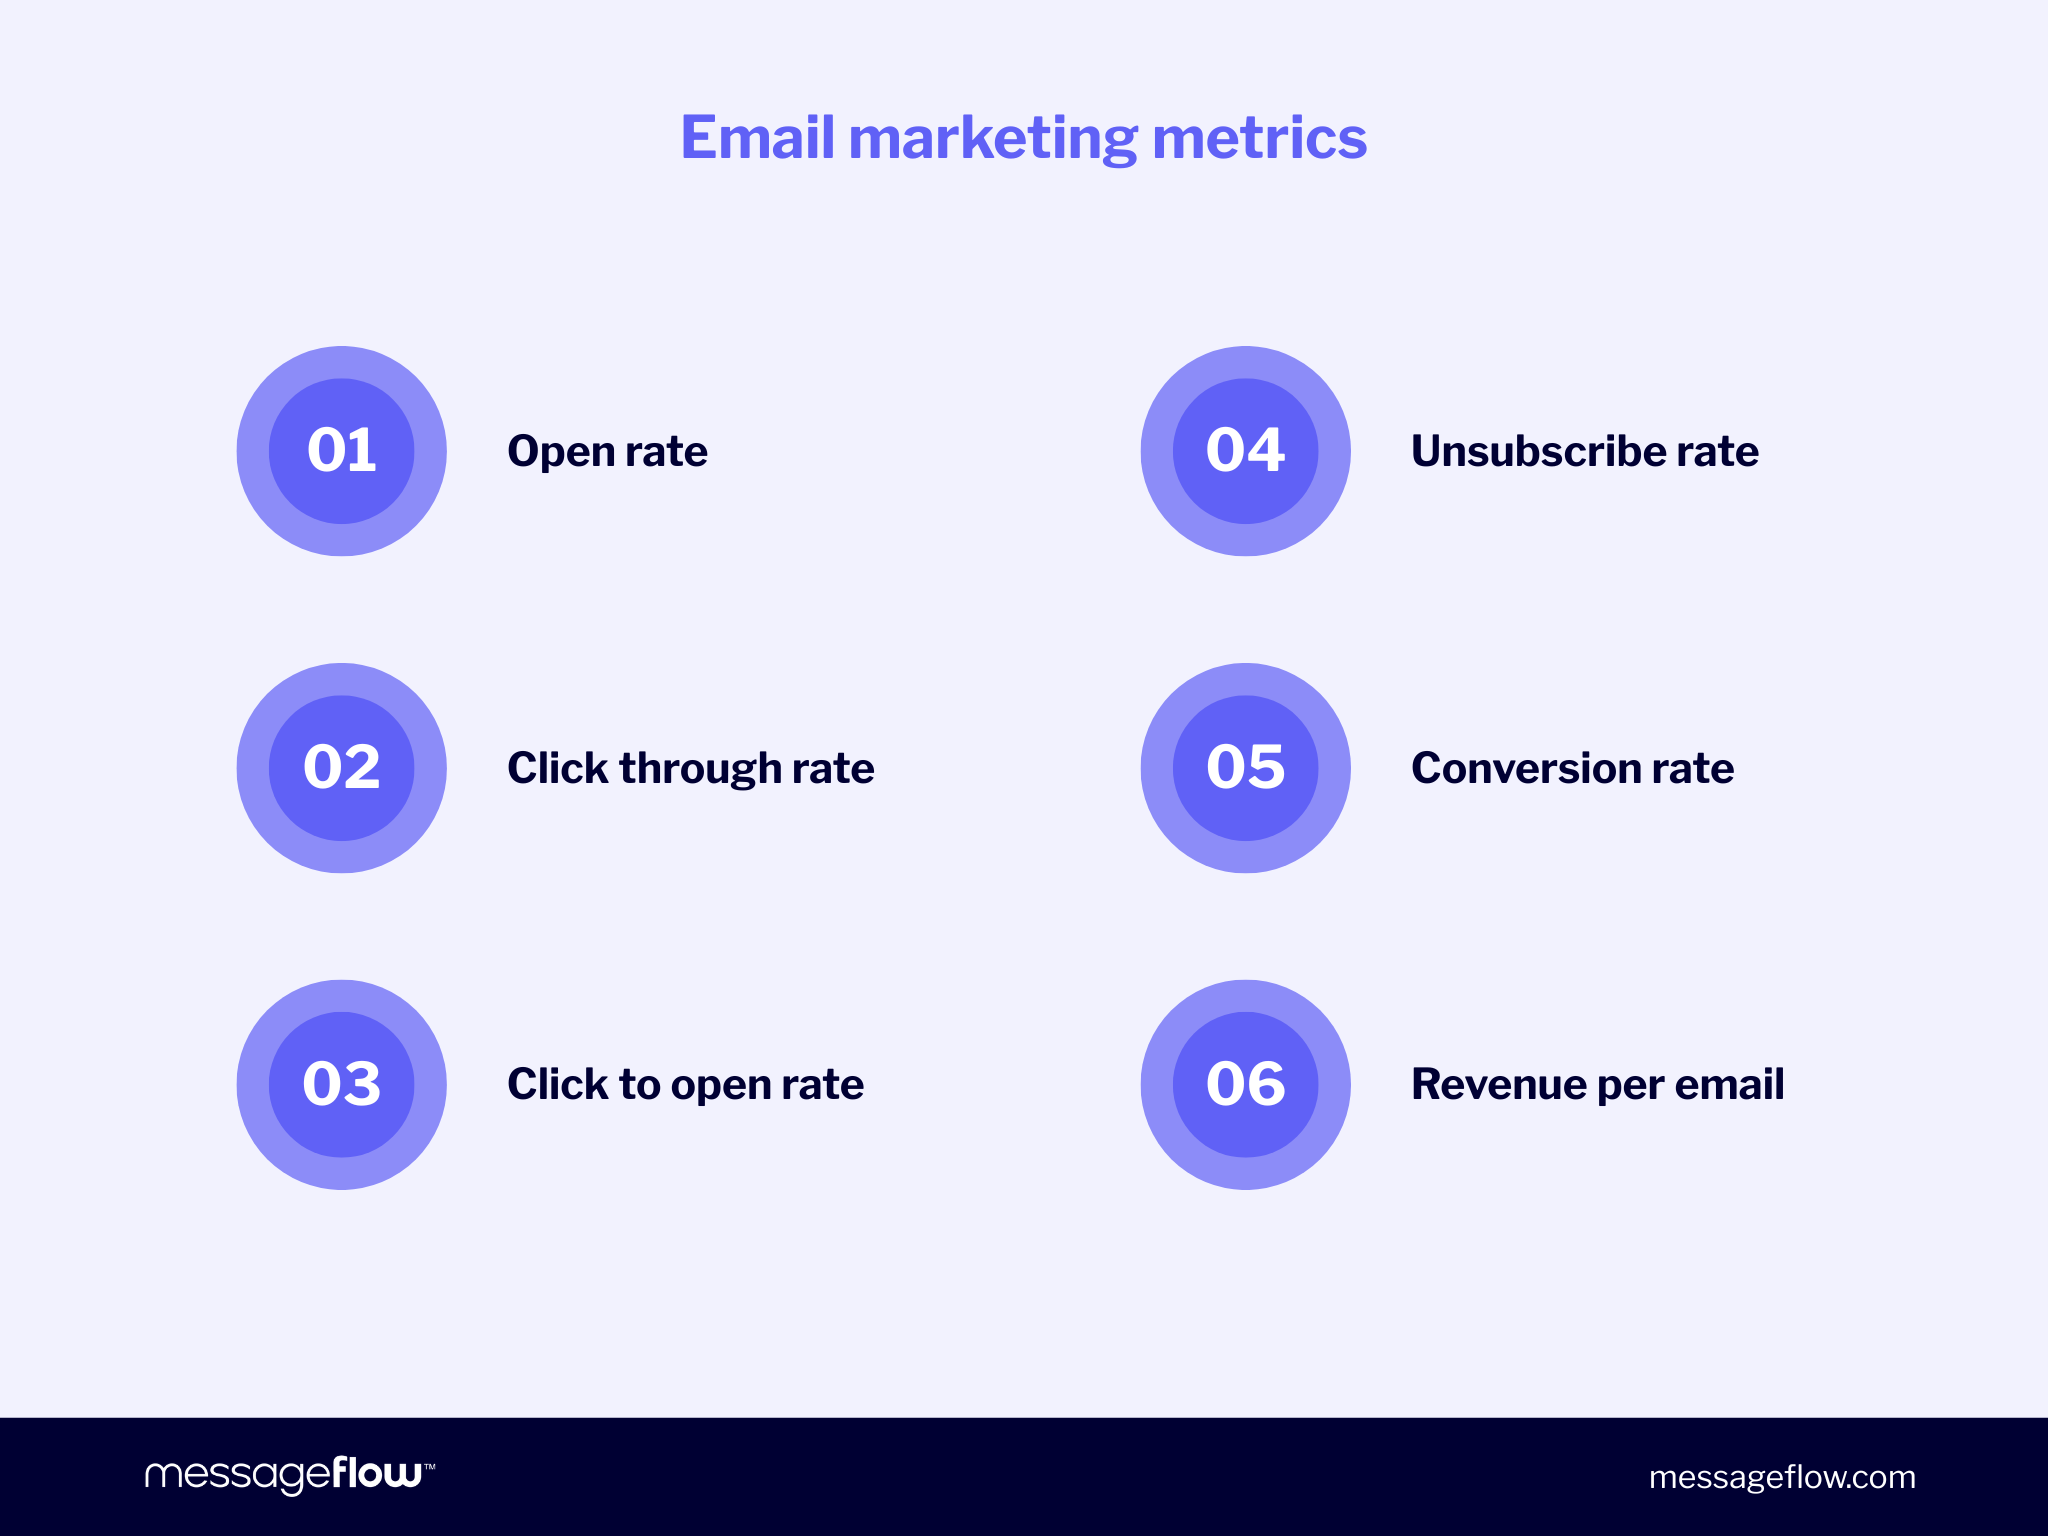
What counts as a metric?
Metrics describe activity and engagement. They help you understand what happened inside a campaign.
Open rate
Click-through rate (CTR)
Click-to-open rate (CTOR)
Unsubscribe rate
Conversion rate
Revenue per email
These are all part of your broader email marketing metrics framework. They’re diagnostic. They help you detect friction, relevance issues, or execution gaps.
But they don’t automatically answer the question your leadership cares about: Did this campaign contribute to revenue or growth?
Key email marketing metrics.
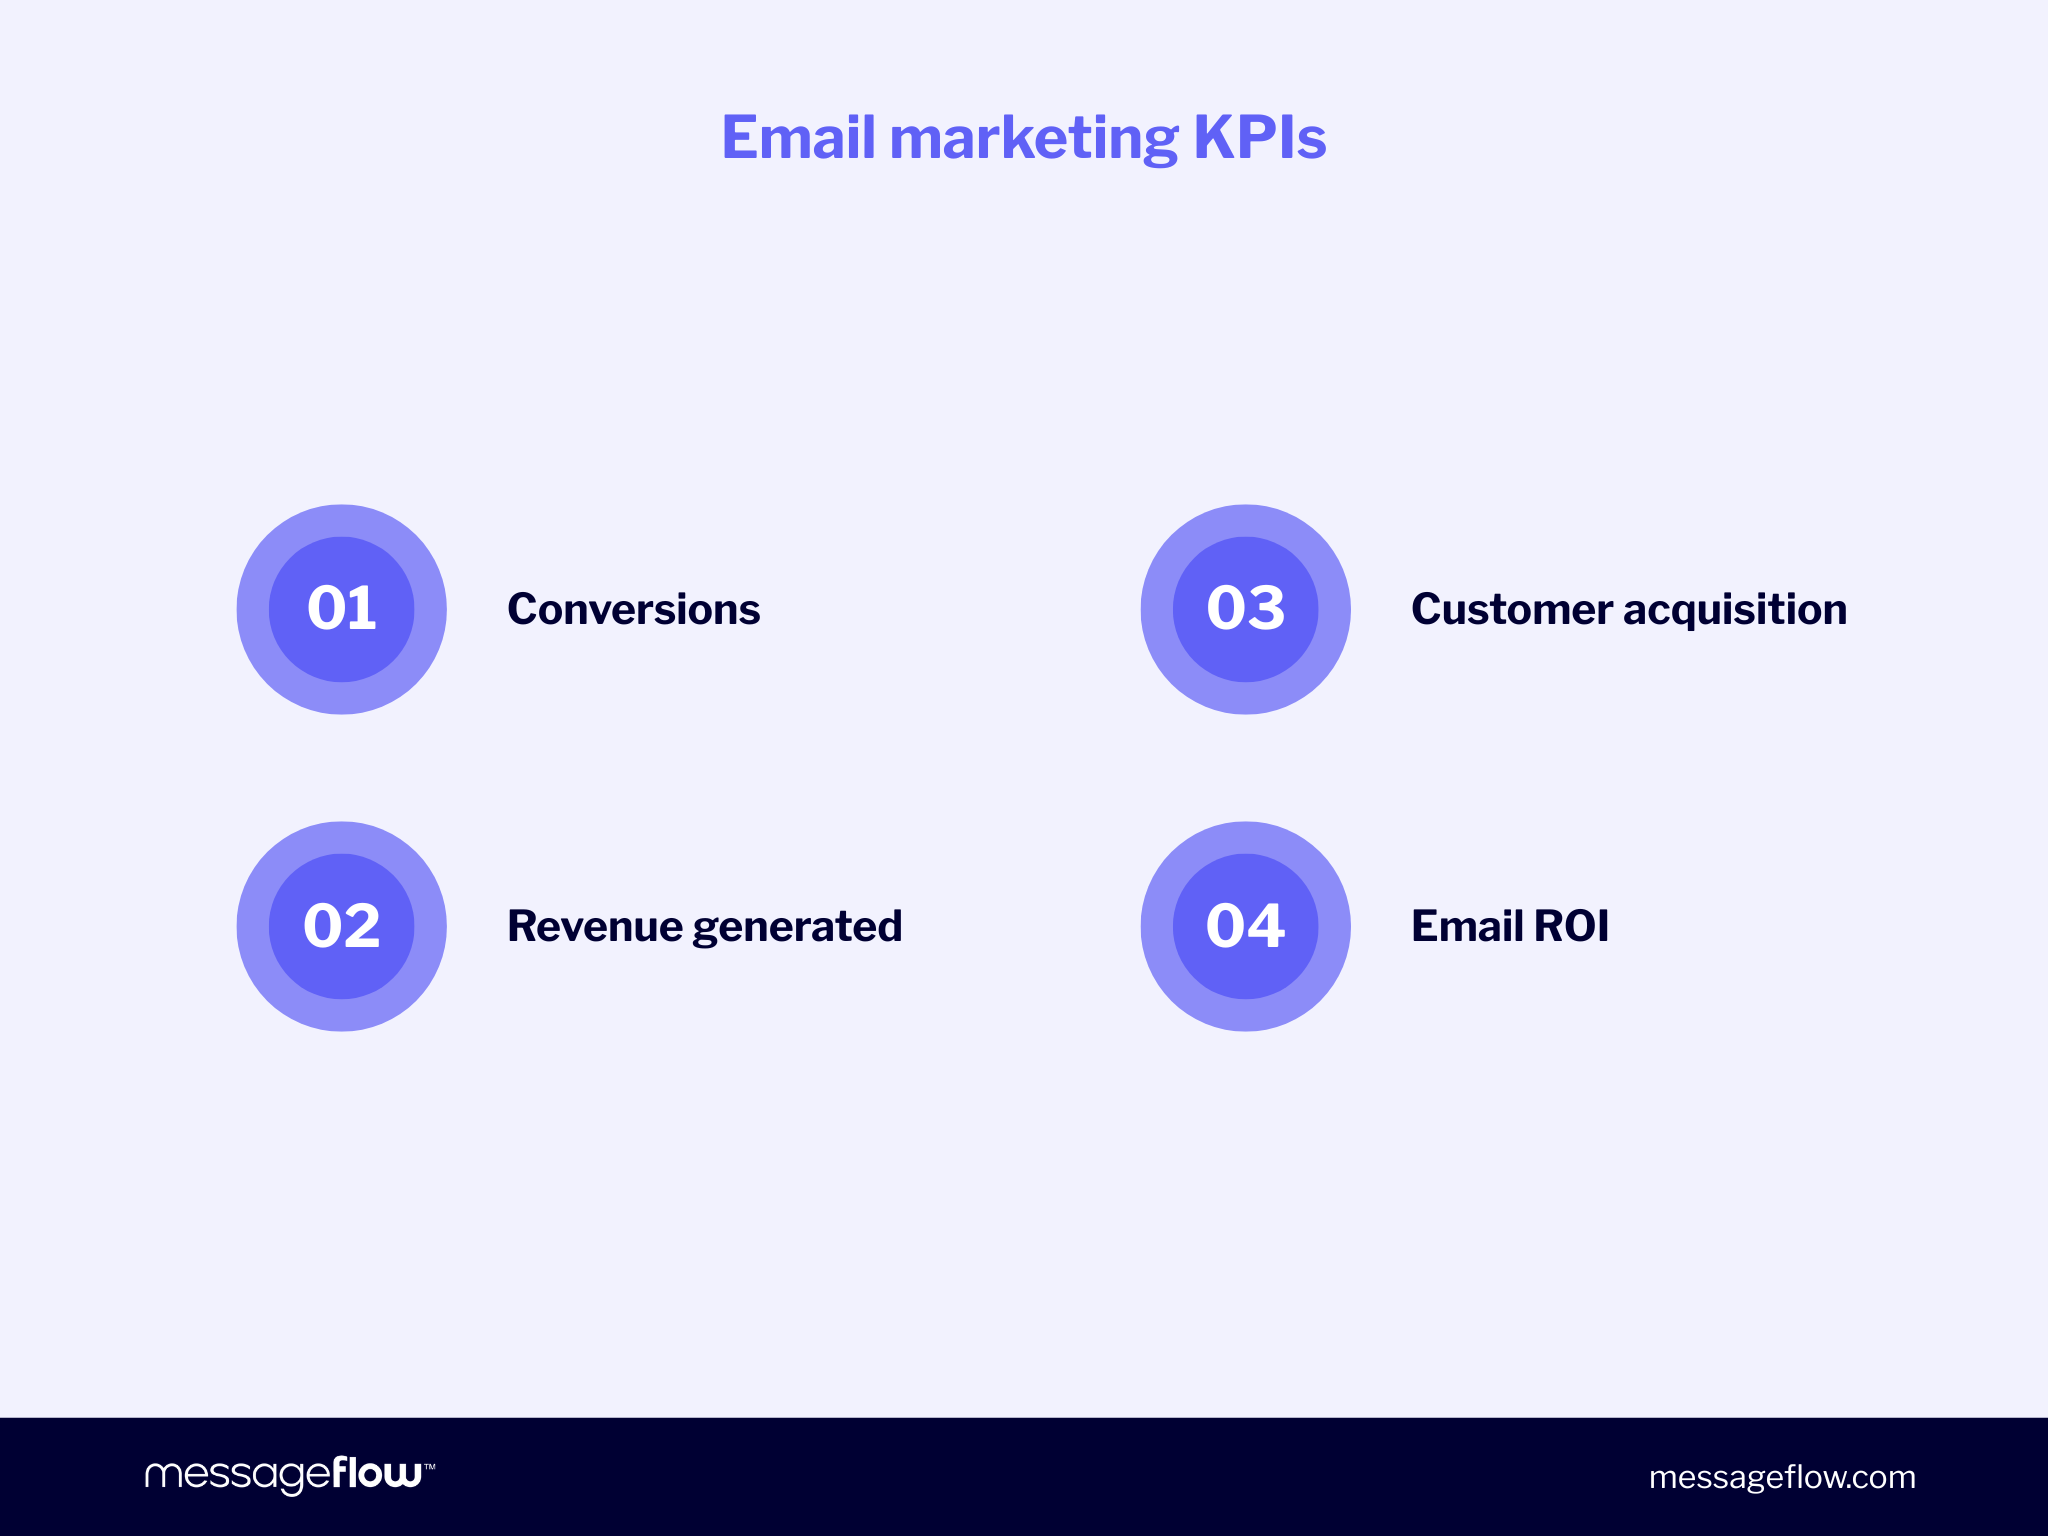
What makes a KPI a KPI?
A KPI connects activity to business impact. For most teams, the core email marketing KPIs include:
Conversions
Revenue generated
Customer acquisition or retention contribution
And ultimately, email ROI
That last one is the bridge between marketing performance and financial accountability.
You can have a 45% open rate and still generate no revenue. You can have a modest CTR and still produce strong profit margins.
If you optimize only for engagement metrics, you risk building campaigns that look good in reports but underperform commercially.
Key email marketing KPIs.
A practical way to think about it
I like to structure reporting in three layers:
Delivery layer – Did the email reach the inbox?
Engagement layer – Did recipients interact?
Business layer – Did interaction translate into measurable value?
Metrics dominate the first two layers. KPIs define the third.
💡 When we talk about email performance, what we’re really evaluating is how efficiently we move recipients from delivery → engagement → revenue.
The mistake isn’t tracking too many metrics, it’s failing to anchor them to outcomes.
The core email marketing KPIs that actually matter
If you strip away the noise, five indicators consistently define email marketing effectiveness across ecommerce, SaaS, B2B, and media:
Open rate
Click-Through Rate
Click-to-Open Rate
Conversions
ROI
Each answers a different performance question. Together, they tell a story. Let’s unpack them – both in terms of what they mean and how to interpret them.
Open rate – Attention indicator with context
What it measures: The percentage of delivered emails that were opened.
Open rate has become controversial. Privacy changes (especially Apple Mail) have inflated reporting and reduced precision. Still, dismissing it entirely is a mistake.
Open rate remains useful for:
Comparing subject line performance
Testing send times
Identifying list fatigue trends
What it doesn’t reliably measure anymore is true human attention at an individual level.
If your open rate drops significantly across segments, that’s a signal. If it’s stable but revenue declines, the issue is likely downstream. Treat open rate as an early indicator, not a revenue metric.
Click-through rate – Engagement strength
What it measures: The percentage of delivered emails that generated at least one click.
CTR answers a more meaningful question: Did the content motivate action?
Unlike opens, clicks represent active intent. If open rate is strong but CTR is weak, your subject line works but your message doesn’t convert interest into action.
For many teams, CTR is the first KPI where optimization becomes commercial rather than cosmetic.
Click-to-open rate – Message relevance
What it measures: The percentage of opens that resulted in clicks.
This metric isolates content performance by removing delivery and subject-line influence. If CTOR is low:
The offer may not resonate.
The CTA might lack clarity.
The message-to-audience match may be off.
CTOR is especially useful when comparing segmented campaigns.
High segmentation + strong CTOR often indicates you’re aligning content with intent – a core driver of long-term email performance.
Conversions – Where marketing becomes revenue
What it measures: The percentage or count of recipients who completed a defined business action.
This could be:
A purchase
A demo booking
A trial activation
A content download
Conversions connect engagement to business impact. At this point, you move beyond surface-level email marketing metrics and into commercial performance.
💡 Tracking conversions properly requires clean attribution, typically through UTM parameters and analytics integration. Without this, your revenue reporting will always be incomplete.
ROI – The ultimate accountability metric
What it measures: The return generated relative to the cost of your email marketing program.
This is where email ROI separates tactical execution from strategic contribution.
A campaign can have average engagement but excellent margins. Another can drive traffic but destroy profitability through discounts.
When leadership evaluates budget allocation, they don’t ask about CTOR. They ask: What was the return?
And this is where many marketers get uncomfortable because ROI requires financial thinking, not just campaign analytics.
We’ll break down a simple formula for calculating email ROI in the next section along with a practical example you can adapt to your own reporting.
But first, let’s condense everything into something immediately usable: a KPI cheat sheet you can reference before your next campaign review.
KPI cheat sheet: What to track, what’s “good,” and what to do if it drops
KPI
What it means
Typical “healthy” range*
If it drops, check…
Open Rate
% of delivered emails opened
20-40% (varies by industry & list quality)
Subject line strength, sender recognition, list fatigue
CTR
% of delivered emails that generated a click
2-5% (higher for segmented campaigns)
CTA clarity, offer relevance, visual hierarchy
CTOR
% of opens that led to clicks
10-20%
Message-to-audience fit, segmentation logic
Conversion Rate
% of recipients who completed desired action
Highly context-dependent
Landing page friction, pricing, alignment between email and offer
If you operate in a broader omnichannelcommunication strategy, email may play a nurturing or retargeting role rather than aim for direct conversion. In that case, evaluating performance purely on last-click metrics would distort the real contribution.
This is why serious teams eventually focus less on surface averages and more on email ROI as the final accountability metric.
ROI in email marketing: Simple formula & practical example
At some point, every marketing conversation lands on the same question: Yes, but what did it generate?
That’s where email ROI steps in as the financial argument for why the channel deserves budget, automation, and executive attention.
The basic email ROI formula
Email ROI = (Revenue from Email Campaign − Total Campaign Cost) / Total Campaign Cost × 100
That’s it. No advanced modeling required. What matters is being disciplined about what you include in “cost.”
What counts as revenue?
Revenue should include:
Direct purchases attributed to the campaign
Assisted conversions (if using multi-touch attribution)
Upsells or renewals triggered by the email
This is where clean tracking becomes critical. UTM parameters and analytics integration are not optional if you want credible reporting.
Many teams underestimate cost by ignoring internal time or margin erosion from aggressive discounts. That inflates reported email ROI and creates unrealistic expectations later.
Be conservative. It builds trust.
Example calculation
Let’s say:
Campaign revenue: $48,000
Platform + creative + operational cost: $4,000
(48,000 − 4,000) / 4,000 × 100 = 1,100%
That means: For every $1 invested, the campaign generated $11 in return.
This is why email marketing effectiveness is often described as one of the strongest in digital marketing, when executed correctly.
But here’s the nuance – high ROI doesn’t automatically mean optimal strategy.
If a campaign delivers massive ROI but low total revenue, scaling may matter more than margin. If revenue is high but ROI is shrinking, efficiency may need attention.
The real value of email ROI isn’t just proving success. It’s guiding decisions like:
Should we increase send frequency?
Should we invest more in segmentation?
Should we automate lifecycle flows?
Should email play a bigger role in our cross-channel mix?
ROI turns email from a communication tool into a financial lever.
Now let’s talk about something even more important than calculating numbers: how to interpret them intelligently and what to optimize when performance shifts.
Interpreting the data: Turning email metrics into decisions
Collecting email marketing metrics isn’t hard.
Interpreting them correctly, without jumping to the wrong conclusions, is where experienced teams separate themselves from reactive ones.
Let’s walk through common performance scenarios and what they usually mean.
Scenario 1: High open rate, low CTR
What it suggests:
Subject line works.
Content or offer doesn’t.
This is often a positioning problem. The promise in the inbox isn’t aligned with what’s inside the email.
What to review:
Headline clarity
CTA visibility above the fold
Offer relevance for the specific segment
Whether the email tries to do too much
This is rarely a design tweak issue. It’s usually a message-to-audience fit.
Scenario 2: Strong CTR, weak conversions
This is where it’s easy to get frustrated. The email clearly drives traffic but sales don’t follow.
Possible causes:
Landing page friction
Slow load time (especially mobile)
Price shock
Offer mismatch
Weak social proof
At this point, email may be doing its job perfectly. The bottleneck is downstream. If you measure email performance only at the click level, you’ll miss this completely.
Scenario 3: Stable engagement, declining ROI
This one’s subtle. CTR and conversions look fine. Revenue remains decent. But ROI shrinks.
Common reasons:
Rising platform or acquisition costs
Increased discounting
Lower average order value
Higher creative production expense
This is why ROI must be calculated consistently, not occasionally. Monitoring email ROI over time reveals margin erosion early.
Scenario 4: Everything drops
Open rate, CTR, conversions – all trending downward.
Before blaming email fatigue, check:
List growth quality
Over-sending frequency
Segmentation decay
Audience shifts
Email programs rarely collapse overnight. They deteriorate gradually when segmentation stops evolving.
This is where advanced analytics becomes a competitive advantage.
When you can slice performance by cohort, segment, or lifecycle stage, diagnosing problems becomes faster and less political.
Optimization levers that actually move the needle
If you want to improve email marketing effectiveness, focus on levers with compounding impact:
Segmentation depth
Behavioral triggers instead of batch sends
Clear, singular CTAs
Alignment between subject line and core message
Post-click experience consistency
Small incremental improvements in each layer – delivery, engagement, conversion – multiply.
A 10% lift in open rate. A 15% lift in CTR. A 10% lift in conversion rate.
Together, they dramatically increase revenue and ultimately improve email ROI without increasing send volume.
Where tools and analytics come in
At a certain scale, spreadsheets stop being enough.
If you’re running email as part of a broader cross-channel strategy – alongside SMS, mobile push, or other messaging channels – you need unified visibility.
That means:
Real-time campaign dashboards
Click heatmaps to identify interaction zones
Integration with Google Analytics for conversion tracking
Clear attribution logic
In our own work at MessageFlow, we’ve seen how access to granular analytics changes conversations about email marketing internally.
When performance discussions shift from How did it feel? to Here’s the segment-level ROI trend over six months, budget decisions become easier.
And when you connect email API infrastructure with analytics, you gain control over transactional and marketing performance in one reporting environment which matters in enterprise evaluation.
But tools don’t create performance. They make performance measurable. And measurement, done properly, drives smarter optimization.
FAQ: Email marketing KPIs & ROI
Below are some of the most common questions we hear from marketing managers and growth leads evaluating email marketing KPIs and performance.
The core email marketing KPIs most teams should track are:
Open rate
Click-Through Rate
Click-to-Open Rate
Conversion rate
Email ROI
OR and CTR measure attention and engagement. Conversions and ROI connect activity to business outcomes.
If you have to prioritize, start with conversions and ROI – those are the numbers leadership ultimately evaluates.
The standard formula for email ROI is:
Email ROI = (Revenue from Email Campaign − Total Campaign Cost) / Total Campaign Cost × 100
Without disciplined cost accounting, ROI becomes inflated and misleading.
Yes but differently than before. Due to privacy changes, open rate is less precise at the individual level. However, it still works as:
A comparative testing metric
A trend indicator
A signal of subject line effectiveness
It should not be used as a standalone indicator of email marketing effectiveness or revenue contribution.
CTOR measures clicks as a percentage of opens.
CTR measures clicks as a percentage of delivered emails.
CTR reflects overall engagement from delivery to action. CTOR isolates how well the content performs once opened.
If CTR is low but CTOR is strong, your subject line may be underperforming. If CTOR is weak, your message likely needs refinement.
Conversion tracking typically requires:
UTM parameters appended to links
Analytics platform integration (e.g., Google Analytics)
Defined conversion events (purchase, demo, signup, etc.)
If you operate across multiple channels – email, SMS, push – consistent attribution logic becomes essential. Otherwise, you risk undervaluing email’s role in assisted conversions.
Accurate conversion tracking is the foundation for calculating credible email ROI.
Final thoughts: Measure what advances the business
Email is easy to send. It’s harder to run it like a performance channel.
When you shift focus from surface-level email marketing metrics to outcome-driven KPIs, ROI especially, email stops being “just another channel.”
It becomes:
A predictable revenue driver
A scalable growth lever
A defensible budget line
If your current reporting doesn’t clearly connect engagement to revenue, that’s your next improvement area.
And if your tooling doesn’t give you transparent, segment-level email API analytics, including conversion tracking and ROI visibility, upgrading your measurement stack may matter more than increasing send volume.
The teams that win with email aren’t the ones sending the most campaigns. They’re the ones measuring the right things and acting on them consistently.
Choose the perfect one-stop-shop for your omnichannel communication